


論文情報
(インドネシアの自主的に決定する約束草案と整合的な低炭素エネルギー発展シナリオ)
著者:Ucok W.R. Siagian , Bintang B. Yuwono, Shinichiro Fujimori and Toshihiko Masui
発表年:2017
掲載雑誌:Energies
論文へのリンク(英文のみ)
キーワード
インドネシア; 低炭素エネルギー開発; AIMモデル; 温室効果ガス排出削減; 各国が自主的に決定する約束草案(INDC); 効率的な対策; 再生可能エネルギー; 緩和費用; 経済発展への影響
概要
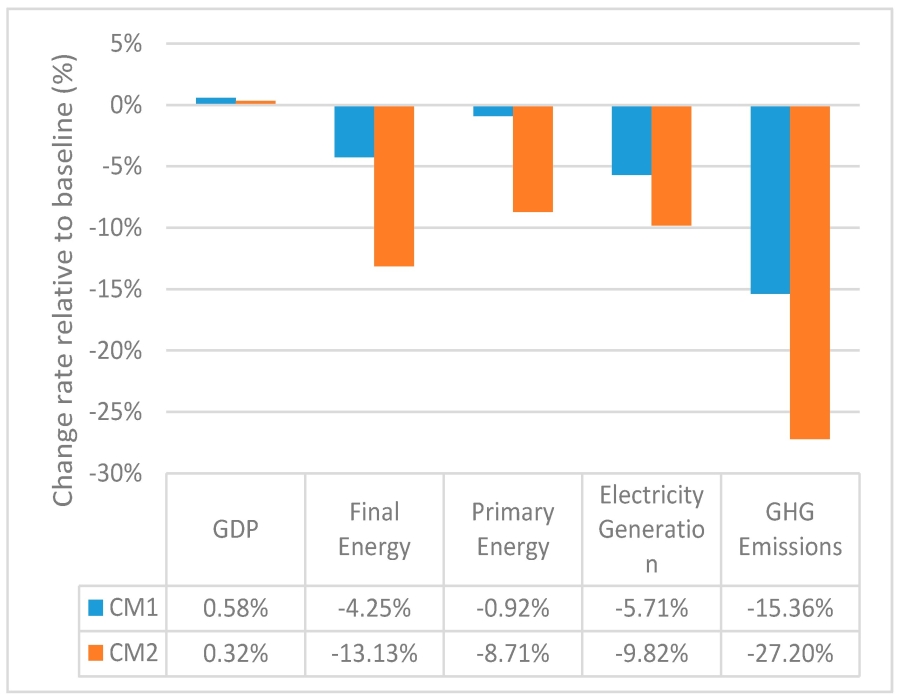
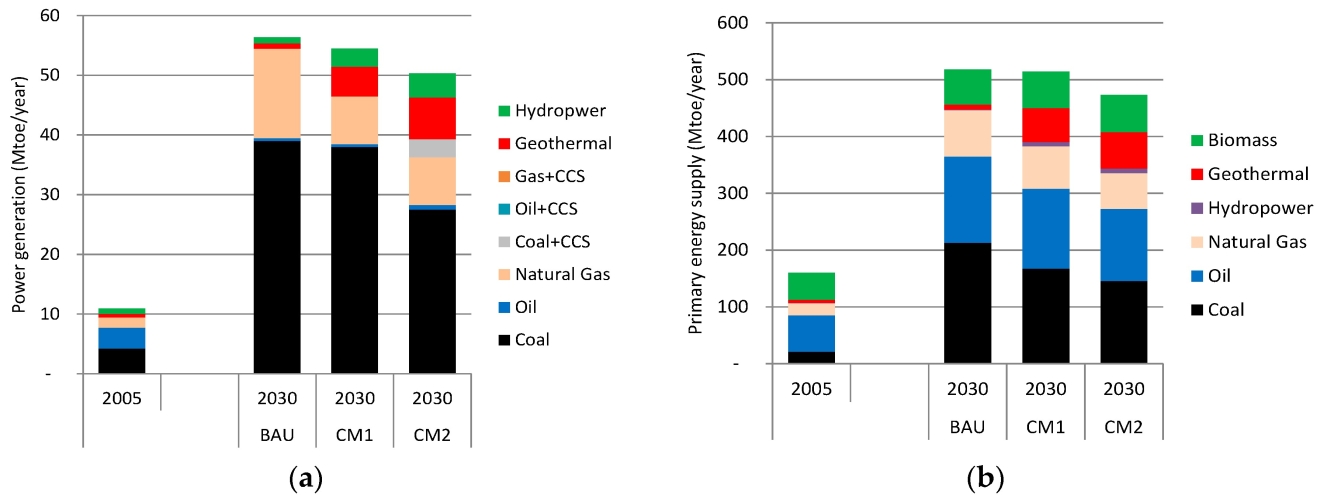
本研究は、2030年までにインドネシアのエネルギー部門の温室効果ガス排出量を削減するための低炭素エネルギー技術の役割を分析した。インドネシア政府は2030年までの排出量削減戦略と計画を策定し、排出量削減目標を設定しています。本研究はAIM / CGEモデルを用いて、ベースライン、対策1(CM1)、およびCM2の3つのシナリオを同じ社会経済的条件下での排出量、エネルギー供給量などを定量化した。その結果、インドネシアの低炭素エネルギーシステムは、エネルギー効率の改善と、炭素集約型エネルギーシステムの導入という2つの柱(すなわち、電力および輸送部門における再生可能エネルギーの使用、および電力部門および輸送部門における天然ガスの使用)が必要であることがわかった。CM1のもとでは、ベースラインシナリオと比較して15.5%の排出削減目標を達成することができた。この削減は、最終エネルギー需要を4%削減する効率対策を用いて達成することができた。また、ベースラインのシナリオの6倍の速度で地熱発電所を配備し、水力発電の4倍の電力を使用することを想定している。さらに、より大きな炭素削減量を想定したCM2(すなわち、27%の減少)は、定性的にはCM1と同様の手段で達成され得るが、より強く対策を浸透させる必要がある。最終エネルギー需要は13%削減する必要があり、地熱発電所の設置はベースライン時の7倍、水力発電はベースラインの場合の5倍にする必要がある。 CM1とCM2の炭素価格は、それぞれ16ドルと63ドル(2005年)/ tCO2であった。 2030年の緩和シナリオは、ベースラインシナリオと比べて国内総生産(GDP)に小さなプラスの効果をもたらした。これは、主に2つの仮定の組み合わせによるものである。第1は、ベースラインのシナリオでは、石炭火力の大幅な増加があるということです。もう一つの仮定は、石炭関連産業では生産性が低いということです。最終的に、石炭関連産業からCMケースの他の低炭素排出部門に資本や労働などの要因が移行すると、経済全体の生産性が低炭素投資を相殺することになる。
This study analyzed the role of low-carbon energy technologies in reducing the greenhouse gas emissions of Indonesia’s energy sector by 2030. The aim of this study was to provide insights into the Indonesian government’s approach to developing a strategy and plan for mitigating emissions and achieving Indonesia’s emission reduction targets by 2030, as pledged in the country’s Intended Nationally Determined Contribution. The Asia-Pacific Integrated Model/Computable General Equilibrium (AIM/CGE) model was used to quantify three scenarios that had the same socioeconomic assumptions: baseline, countermeasure (CM)1, and CM2, which had a higher emission reduction target than that of CM1. Results of the study showed that an Indonesian low-carbon energy system could be achieved with two pillars, namely, energy efficiency measures and deployment of less carbon-intensive energy systems (i.e., the use of renewable energy in the power and transport sectors, and the use of natural gas in the power sector and in transport). Emission reductions would also be satisfied through the electrification of end-user consumption where the electricity supply becomes decarbonized by deploying renewables for power generation. Under CM1, Indonesia could achieve a 15.5% emission reduction target (compared to the baseline scenario). This reduction could be achieved using efficiency measures that reduce final energy demand by 4%; This would require the deployment of geothermal power plants at a rate six times greater than the baseline scenario and four times the use of hydropower than that used in the baseline scenario. Greater carbon reductions (CM2; i.e., a 27% reduction) could be achieved with similar measures to CM1 but with more intensive penetration. Final energy demand would need to be cut by 13%, deployment of geothermal power plants would need to be seven times greater than at baseline, and hydropower use would need to be five times greater than the baseline case. Carbon prices under CM1 and CM2 were US$16 and US$63 (2005)/tCO2, respectively. The mitigation scenarios for 2030 both had a small positive effect on gross domestic product (GDP) compared to the baseline scenario (0.6% and 0.3% for CM1 and CM2, respectively). This is mainly due to the combination of two assumptions. The first is that there would be a great increase in coal-fired power in the baseline scenario. The other assumption is that there is low productivity in coal-related industries. Eventually, when factors such as capital and labor shift from coal-related industries to other low-carbon-emitting sectors in the CM cases are put in place, the total productivity of the economy would offset low-carbon investment.