Projected land-use changes in the Shared Socioeconomic Pathways: Insights and implications

Ronald C. Estoque, Makoto Ooba, Takuya Togawa, Yasuaki Hijioka
2020.6.8

論文情報

 Projected land-use changes in the Shared Socioeconomic Pathways: Insights and implications

著者: Ronald C. Estoque, Makoto Ooba, Takuya Togawa, Yasuaki Hijioka
年:2020
掲載誌:AMBIO, https://doi.org/10.1007/s13280-020-01338-4

論文へのリンク(英文のみ)

要旨

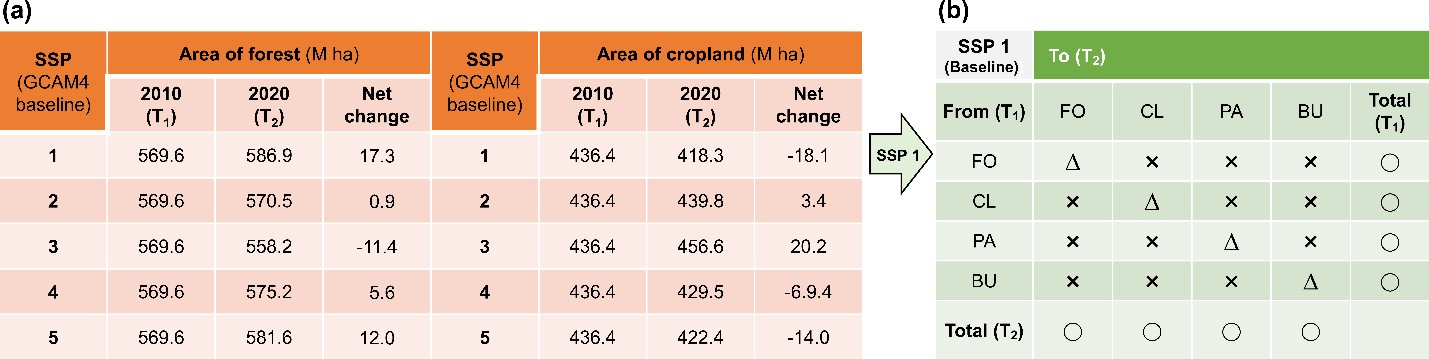
The conceptualization of the Shared Socioeconomic Pathways (SSPs) framework represented a major leap in scenario development in the context of global environmental change and sustainability, providing significant advances from the previous scenario frameworks—especially the Intergovernmental Panel on Climate Change (IPCC) Special Report on Emissions Scenarios. It is highly likely that the SSP concept, along with its scenario narratives and their respective results, including land-use change projections, will play a substantial role in the forthcoming Sixth Assessment Report by the IPCC. Here, we offer some insights that could make the SSPs’ projected future changes in global land use more comprehensive and also help improve the interpretability of such projections. For example, instead of focusing on the quantity of each land-use class at various time points which results only in a net change when change is detected between time points, we recommend that the projected gross gains and gross losses in each land-use class across all scenarios should also be considered. Overall, the insights presented could also help pave the way for stronger collaboration between the SSP-climate science community and the land system science community; such collaboration is much needed in addressing the challenges of global environmental change towards a climate-resilient sustainable development pathway.

Fig. 2. Land-use changes and a land-use transition matrix. (a) Land-use changes between two points in time as projected across five SSP scenarios and (b) a hypothetical land-use transition matrix between the same two points in time for SSP 1. In (a), all of the baseline SSPs projected for Asia by the GCAM4 model (Table 2) are shown. For this example, 2010 and 2020 were used as time points T1 and T2, respectively, and the projected areas of pasture (PA) and built-up area (BU) are not shown. In (b), this type of transition matrix is fundamental to the study of land-use/land-cover change, but it is not currently available in the SSP Public Database. It is also used as a primary input in land change modeling. The symbol O indicates values that are readily available in the SSP Public Database, similar to those presented in Table 2. The symbol ∆ represents the area of each class that would persist from T1 to T2 but that is not currently available in the SSP Public Database. The symbol × marks the transitions from a particular land-use class to other classes; that is, together with O, it is the information needed to determine ∆, but it is also not available in the SSP Public Database. Gross loss and gross gain of each land-use class between time points can be determined from these transitions. The difference between total gross loss (all cells marked with × in a row) and total gross gain (all cells marked with × in a column) of a class equals the net change that this class experienced between the two time points.