Heat health risk assessment in Philippine cities using remotely sensed data and social-ecological indicators

Ronald C. Estoque, Makoto Ooba, Xerxes T. Seposo, Takuya Togawa, Yasuaki Hijioka, Kiyoshi Takahashi, Shogo Nakamura
2020.6.8

論文情報

 Heat health risk assessment in Philippine cities using remotely sensed data and social-ecological indicators

著者: Ronald C. Estoque, Makoto Ooba, Xerxes T. Seposo, Takuya Togawa, Yasuaki Hijioka, Kiyoshi Takahashi, & Shogo Nakamura
年:2020
掲載誌:Nature Communications 11: 1581

論文へのリンク(英文のみ)

要旨

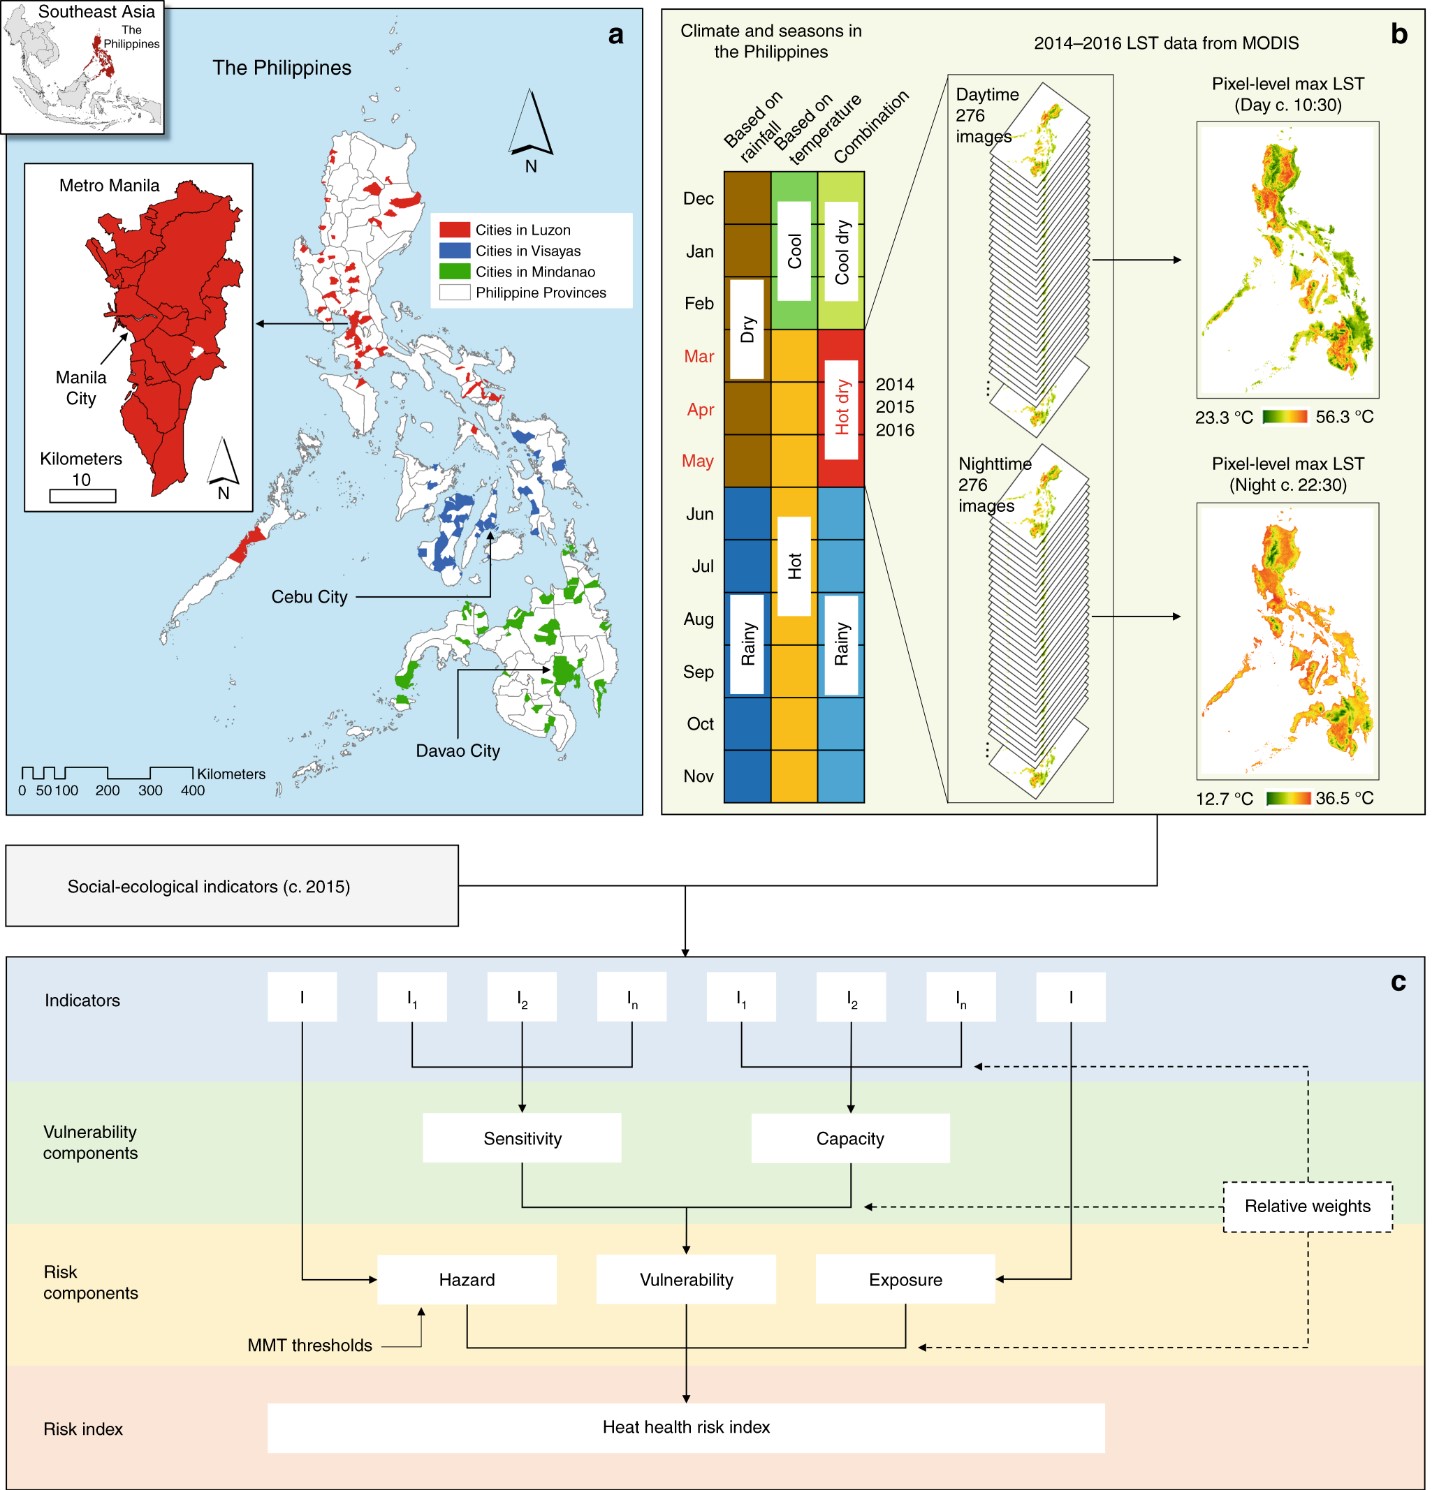
More than half of the world’s population currently live in urban areas and are particularly at risk from the combined effects of the urban heat island phenomenon and heat increases due to climate change. Here, by using remotely sensed surface temperature data and social-ecological indicators, focusing on the hot dry season, and applying the risk framework of the Intergovernmental Panel on Climate Change, we assessed the current heat health risk in 139 Philippine cities, which account for about 40% of the country’s total population. The cities at high or very high risk are found in Metro Manila, where levels of heat hazard and exposure are high. The most vulnerable cities are, however, found mainly outside the national capital region, where sensitivity is higher and capacity to cope and adapt is lower. Cities with high levels of heat vulnerability and exposure must be prioritized for adaptation. Our results will contribute to risk profiling in the Philippines and to the understanding of city-level heat health risks in developing regions of the Asia-Pacific.

Fig. 2. Design and framework of the study. a Spatial distribution of cities across the three main island groups in the Philippines: Luzon, Visayas, and Mindanao. GIS data for administrative boundary layers were sourced from the Philippine GIS Data Clearinghouse (http://philgis.org). b Climate and seasons in the country, with the 2014–2016 satellite-derived land surface temperature (LST) data during the hot dry season (source: https://modis.gsfc.nasa.gov). The climate and seasons in the Philippines were based on data from the official site of PAGASA-DOST (http://bagong.pagasa.dost.gov.ph) and the Project SARAi’s Training Toolkit–Volume 2: Climate, Weather, and Climate Change (http://sarai.ph/). c Diagram showing the nested hierarchical structure of the risk assessment framework employed to operationalize the IPCC’s risk concept in its AR5. Supplementary Table 1 lists the factors and indicators used. See Methods for details.