


Information of Paper
How Will Deforestation and Vegetation Degradation Affect Global Fire Activity?
Authors: Chae Yeon Park, Kiyoshi Takahashi, Junya Takakura, Fang Li, Shinichiro Fujimori, Tomoko Hasegawa, Akihiko Ito, Dong Kun Lee
Year: 2021
Journal: Earth’s Future, 9, e2020EF001786
Keywords
wildfire, land use, climate change, socioeconomic change
Abstract
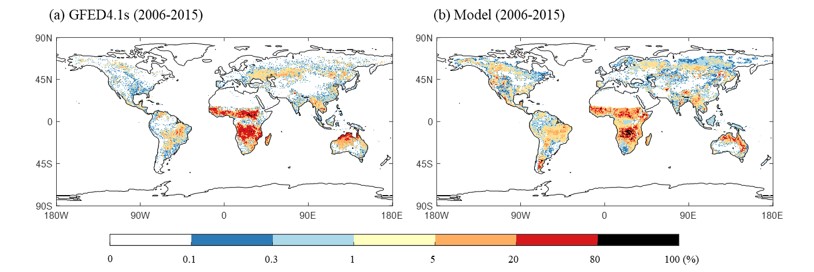
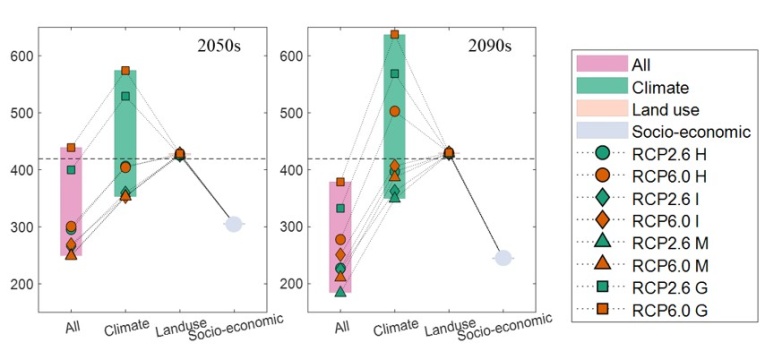
Globally, many parts of fire emissions are driven by deforestation. However, few studies have attempted to evaluate deforestation and vegetation degradation fires (DDF) and predict how they will change in the future. In this study, we expanded a fire model used in the Community Land Model to reflect the diverse causes of DDF. This enabled us to differentiate DDFs by cause (climate change, wood harvesting, and cropland, pastureland, and urban land-use changes) and seasonality. We then predicted the state of fire regimes in the 2050s and 2090s under RCP 2.6 and RCP 6.0 scenarios. Our results indicate that the area affected by global total fires will decrease from the current 452 to 211–378 Mha/yr in the 2090s under RCP 6.0 and to 184–333 Mha/yr under RCP 2.6, mainly due to socioeconomic factors such as population and economic growth. We also predict that DDF will decrease from the current 73 million hectares per year (Mha/yr) to 54–66 Mha/yr in the 2090s under RCP 6.0 and 46–55 Mha/yr under RCP 2.6. The main contributor to these decreases in DDF burned area was climate change, especially the increasing of precipitation. The impact of future land use change on future DDF was similar or slightly lower than present-day. South America, Indonesia, and Australia were identified as high-risk regions for future DDF, mainly due to the expansion of wood harvest and pastureland. Appropriate land and fire management policies will be needed to reduce future fire damage in these areas.