


Information of Paper
Authors:Shinichiro Fujimori1,2, Izumi Kubota1, Hancheng Dai1, Kiyoshi Takahashi1, Tomoko Hasegawa1,2, Jing-Yu Liu1, Yasuaki Hijioka1, Toshihiko Masui1 and Maho Takimi3
1 Center for Social and Environmental Systems Research, National Institute for Environmental Studies (NIES)
2 International Institute for Applied Systems Analysis
3 Mizuho Information & Research Institute, Inc.
Year:2016
Information of Journal:Environmental Research Letters
Link to the paper
Abstracts
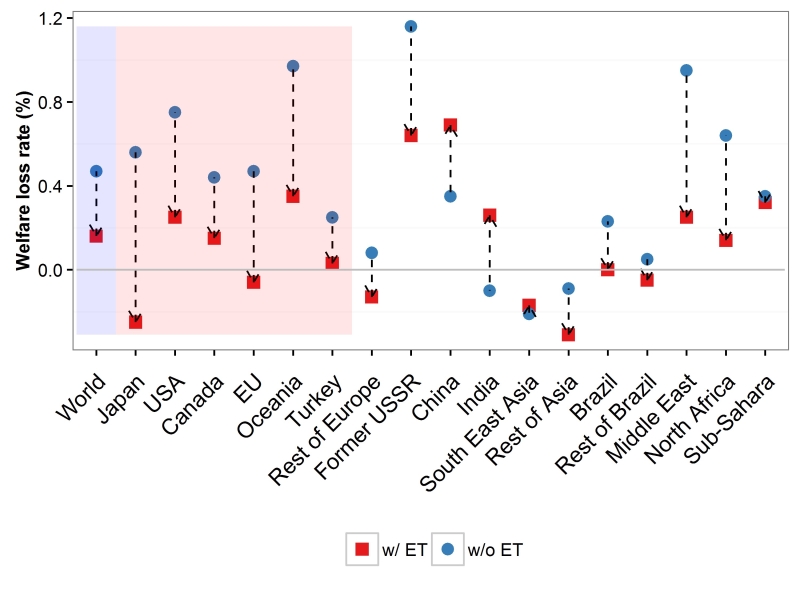
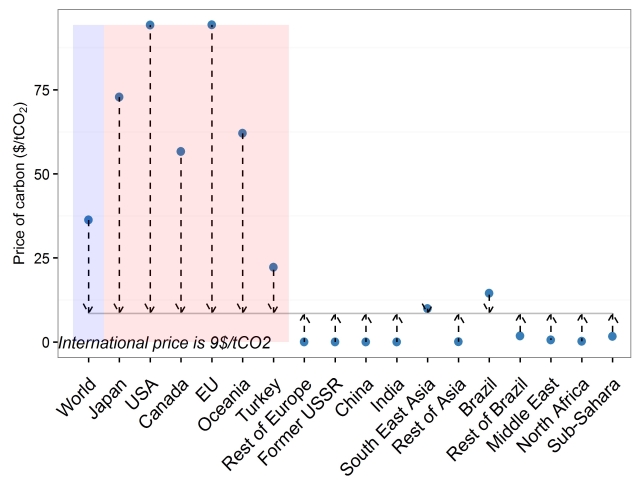
Under the Paris Agreement, parties set and implement their own emissions targets as nationally determined contributions (NDCs) to tackle climate change. International carbon emissions trading is expected to reduce global mitigation costs. Here, we show the benefit of emissions trading under both NDCs and a more ambitious reduction scenario consistent with the 2 °C goal. The results show that the global welfare loss, which was measured based on estimated household consumption change in 2030, decreased by 75% (from 0.47% to 0.16%), as a consequence of achieving NDCs through emissions trading. Furthermore, achieving the 2 °C targets without emissions trading led to a global welfare loss of 1.4%–3.4%, depending on the burden-sharing scheme used, whereas emissions trading reduced the loss to around 1.5% (from 1.4% to 1.7%). These results indicate that emissions trading is a valuable option for the international system, enabling NDCs and more ambitious targets to be achieved in a cost-effective manner.