
Reduced CO2 uptake by the terrestrial biosphere at northern mid-to-high latitudes contributed to the rapid rise in atmospheric CO2 during 2023–2024
—from CO2 source/sink estimation using GOSAT data—
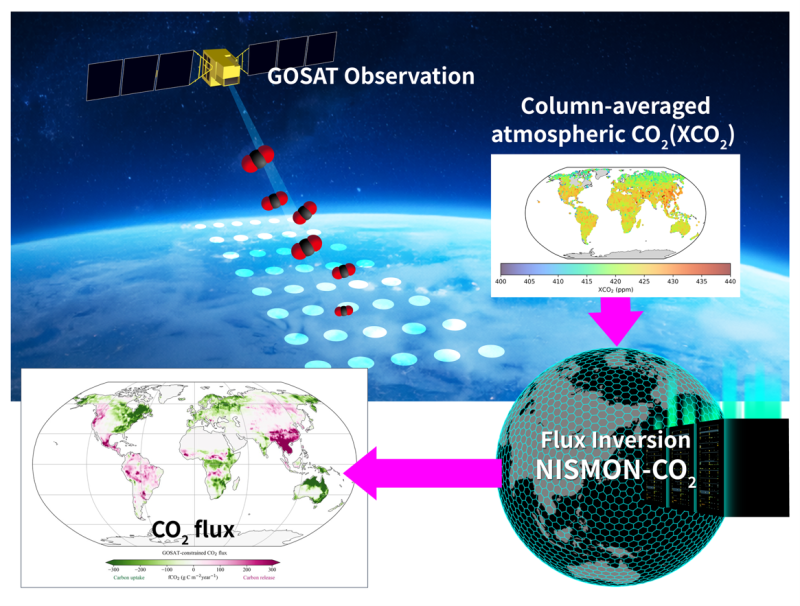
Figure 1: Schematic diagram of the analysis flow. Satellite observations of column-averaged atmospheric CO2 (aka XCO2) from GOSAT are combined with a so-called “flux inversion system” to estimate CO2 fluxes. The flux inversion system used is NISMON-CO2, in which the numerical atmospheric simulation model NICAM is incorporated.
1. Background
Carbon dioxide (CO2) is a major long-lived greenhouse gas (GHG) driving global warming. The National Institute for Environmental Studies (NIES), the Ministry of Environment of Japan, and the Japan Aerospace Exploration Agency (JAXA) have been conducting the GHG satellite project, GOSAT series, the first satellite of which, “IBUKI” (GOSAT), has been observing atmospheric CO2 for more than 17 years since April 2009. In 2024, NIES reported that the global atmospheric CO2 growth rate reached 3.5 ppm year-1, the highest reported value in recent history*1. This rapid increase indicated that CO2 accumulated in the atmosphere much faster than usual. The unusually rapid increase was widely thought to be associated with reduced net CO2 uptake by terrestrial ecosystems*2 during the 2023–2024 El Niño event, although the underlying mechanisms have remained unclear.
Understanding the drivers of such rapid CO2 growth is essential for improving our understanding of the global carbon cycle and projecting future climate change. This study estimated surface CO2 fluxes at Earth’s surface from the GOSAT data using a so-called “flux inversion” method. Thanks to the wide coverage of GOSAT (Figure 2), the flux inversion can coherently estimate CO2 fluxes in a global scale.
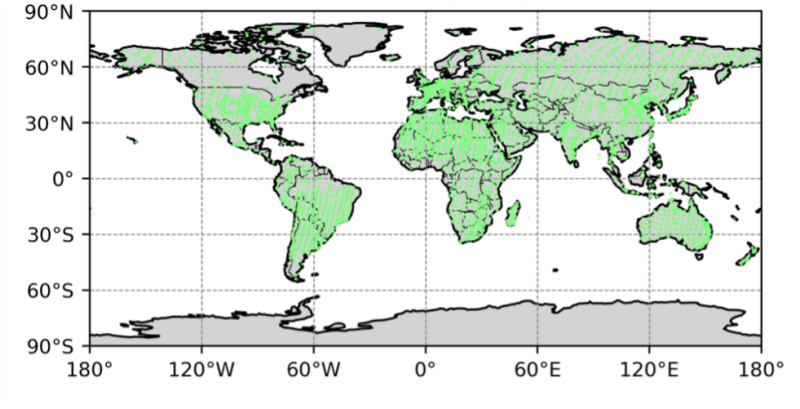
Figure 2: Global distribution of GOSAT XCO2 observations used in this study (for the 2020 case). In this study, only data over land were used in the flux inversion.
2. Method
We used the inversion system based on Nonhydrostatic ICosahedral Atmospheric Model (NICAM), which is named as NICAM-based Inverse Simulation for Monitoring CO2 (NISMON-CO2). NISMON-CO2 estimates surface CO2 fluxes from satellite column-averaged CO2 (aka XCO2) observations (GOSAT SWIR Level 2 XCO2 data (version 03.05))*3. NICAM is a numerical simulation model for computing atmospheric flow. In NISMON-CO2, this simulation is repeated a few hundred times to search for an optimal estimate of fluxes, which requires a powerful computational facility. This study used the supercomputer “Fugaku”*4 for the flux inversion.
Firstly, NICAM simulates how CO2 is transported in the atmosphere by meteorological conditions around the globe considering a set of prior CO2 fluxes. This model simulation is driven by meteorological fields from Japan Reanalysis for Three Quarters of a Century (JRA-3Q) of Japan Meteorological Agency. Then, the system adjusts the prior fluxes within certain uncertainty ranges so that the simulated atmospheric CO2 agrees as closely as possible with the observations from GOSAT. This process, known as flux inversion, provides an optimal estimate of global CO2 fluxes.
3. Results and Discussion
Figure 3 compares global CO2 fluxes calculated using GOSAT observations with those obtained using traditional in-situ observations (IS). Despite different observation sources, GOSAT-constrained fluxes consistently follow those derived using IS, demonstrating the reliability of the satellite-based estimates. The analysis shows that the changes in land ecosystems are the main driver of the year-to-year variability in global CO2 fluxes, while fossil fuel emissions increased steadily during the study period. Within them, the largest fluctuation of the global CO2 flux in 2023–2024, which induced the largest growth rate of CO2 in the atmosphere, was associated with the biospheric component, highlighting the dominant role of terrestrial ecosystems in modulating atmospheric CO2.
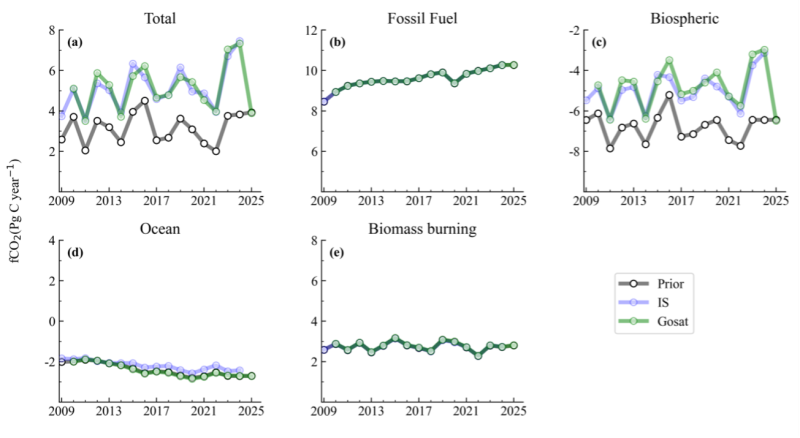
Figure 3: Annual global CO2 flux (fCO2) interannual variation during 2009–2025 for (a) Total flux, (b) fossil fuel emission, (c) biospheric flux, (d) ocean flux and (e) biomass burning emissions. Results are shown for the prior flux (gray), in-situ constrained posterior (blue), and GOSAT-constrained posterior (green). Positive values indicate net source of CO2 to the atmosphere, and negative values indicate net sink.
To investigate the driver of the 2023–2024 anomalous increase in the global CO2 flux, we analyzed its relationship with El Niño–Southern Oscillation (ENSO), a climate phenomenon that strongly influences global weather patterns (Figure 4). Tropical regions (30°N–30°S) showed a response to ENSO with reduced uptake or enhanced CO2 release during El Niño and vice versa, which can be inferred from past studies. However, this study found that a second notable signal also emerged in the mid-to-high latitude regions (30°N–90°N). Although this region has historically shown a relatively weak response to ENSO, it had a substantial increase of carbon source (or decrease of carbon uptake) in 2023–2024. In these two years, the tropics and the northern mid-to-high latitudes additionally increased atmospheric CO2 by 2.22 and 0.84 billion tonnes of carbon, respectively*5. Thus, the northern mid-to-high latitudes contributed one fourth of the net CO2 uptake decrease in the global terrestrial biosphere.
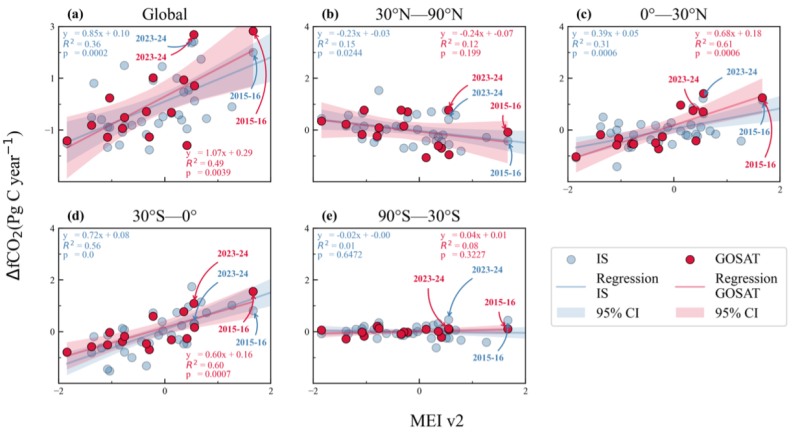
Figure 4: Regression between non-fossil CO2 flux anomalies (ΔfCO2; PgC year-1) and MEI v2 for (a) global, (b) northern mid- to high-latitudes (30°N–90°N), (c) northern tropics (0°–30°N), (d) southern tropics (30°S–0°), and (e) southern mid- to high-latitudes (90°S–30°S). MEI v2 is one of popular ENSO indices. Blue (red) circles/lines represent the IS (GOSAT) inversion. Prior to the regression analysis, all datasets were shifted forward by half a year to better align with the El Niño events, which typically peaks around November–February period. For example, after this shifting, 2023–24 will indicate the annual sum/average during July 2023–June 2024 and so on. Years corresponding to a past El Niño (2015–2016) and the target El Niño (2023–2024) are labeled. A positive slope indicates higher CO2 source or reduced uptake with the increasing MEI (El Niño condition). Shaded regions indicate the 95% Confidence Interval of the fitted regression line. In the northern mid- to high-latitudes, the gradient of the regression line is small, indicating a small sensitivity to ENSO. However, the value of 2023–2024 is located significantly above the regression line beyond the confidence level, suggesting that a large flux increase occurred during this period.
A further analysis indicates that the CO2 flux anomalies in this latitude regions were predominantly driven by temperature anomalies, while fire emission contributed episodically. These results suggest that climate-driven ecosystem responses in the northern region contribute significantly to changes in atmospheric CO2 growth rates, alongside ENSO-related responses in the tropics.
4. Perspectives
The research team plans to expand this analysis by incorporating observations from other ongoing satellite missions, including GOSAT-2 and GOSAT-GW to improve the accuracy, coverage and monitoring capability.
Thanks to its global coverage and short data processing time (about one month), this study has established the method that enables a fast-track analysis. The inversion result up to the end of 2025 is now publicly available in the NIES Global Environmental Database (https://www.nies.go.jp/doi/10.17595/20260414.001-e.html). The team believes that this periodic analysis will facilitate broader use within the scientific community and support research on the global carbon cycle and climate change.
5. Note
1: 2 February 2025 NIES press release “Annual increase of whole-atmosphere mean concentration of carbon dioxide in 2024 was the largest in the past 14 years: preliminary results from “IBUKI” (GOSAT) satellite”
https://www.nies.go.jp/en/pr/news-and-updates/2025/20250214/20250214.html
2: Terrestrial biosphere releases CO2 through biological respiration and decomposition, and absorbs CO2 through photosynthesis. These fluxes vary widely depending on location and season. However, it is expected that, when averaged over a long period in a global scale, terrestrial biosphere acts as a net sink for CO2 and mitigates the increase in atmospheric CO2 concentrations caused by emissions from fossil fuels.
3: The GOSAT data are available from
https://data2.gosat.nies.go.jp/
4: A computer system installed by RIKEN as the successor to the supercomputer “K,” which began shared use in March 2021. It has achieved first place for 11 consecutive terms (through June 2025) in Graph500, one of the major global rankings of supercomputers, and remains at the world’s top level.
5: The difference between the average CO2 flux for 2023–2024 and the climatological one for 2010–2024 was 1.11 billion tonnes of carbon per year (Pg C year-1) in the tropics and 0.42 billion tonnes of carbon per year (Pg C year-1) in the northern mid-to-high latitudes. As a result, the amount of CO2 that remained “extra” in the atmosphere due to the reduction in the net uptake by terrestrial biosphere during these two years (2023–2024) is twice these amounts.
6. Research grant
This research is supported by the Environment Research and Technology Development Fund of the Environmental Restoration and Conservation Agency (JPMEERF24S12200), provided by the Ministry of the Environment of Japan. This work used computational resources of the supercomputer “Fugaku” provided by the RIKEN Center for Computational Science (Project ID: hp250024,hp260016).
7. Published article
【Title】
Drivers of 2023-2024 atmospheric CO2 growth: role of northern mid-to-high latitude land carbon cycle
【Authors】
Maity, S., Niwa, Y., Saeki, T., Someya, Y., Yoshida, Y.
【Journal】Geophysical Research Letters
【URL】http://dx.doi.org/10.1029/2026GL122221(外部サイトに接続します)
【DOI】10.1029/2026GL122221(外部サイトに接続します)
8. Authors
- Research Associate
- MAITY Suman
- Chief Senior Researcher
- NIWA Yosuke
- Senior Researcher
- SAEKI Tazu
- Senior Researcher
- SOMEYA Yu
- Senior Researcher
- YOSHIDA Yukio
9. Contacts
[Contact for this research]
Yosuke Niwa, Chief Senior Researcher
Office for Integrated Emission Assessment, Earth System Division
National Institute for Environmental Studies
[Contact for this press release]
Public Relations Office, Planning Division
National Institute for Environmental Studies
Email: kouhou0 (please append ‘@nies.go.jp’ to complete the email address)