On global estimates of monthly methane flux based on observational data acquired by the Greenhouse gases Observing SATellite "IBUKI" (GOSAT)
National Institute for Environmental Studies
Ministry of the Environment, Japan
Japan Aerospace Exploration Agency
1. Overview of the net methane flux estimates from "IBUKI"
(1) Summary of the methane concentration data from "IBUKI"
After carbon dioxide, methane is the greenhouse gas producing the highest radiative forcing1, and methane concentrations are over double the levels from before the Industrial Revolution, as a result of anthropogenic activities. Accurately monitoring changes in atmospheric methane concentrations and producing estimations of monthly and regional net methane fluxes are useful in facilitating a more accurate understanding of the detailed mechanisms of climate change and its influence on global warming.
An evaluation study2 has found that the "greenhouse gas observation sensor, TANSO-FTS" onboard "IBUKI" observes column-averaged concentrations of methane (the ratio of methane molecules relative to that of dry air, from the earth's surface to the upper extremities of the atmosphere) more accurately when compared with other satellite observations, and this study was quoted in the Intergovernmental Panel on Climate Change (IPCC) Working Group I Fifth Assessment Report. The mean difference (bias) and the standard deviation of the "IBUKI" data (Level 2 Version 2) are estimated at -0.006 ppm and 0.013 ppm3 by comparison with the observational data at the world-wide Total Carbon Column Observing Network's (TCCON)4 ground validation sites.
This means that the methane concentration data acquired by "IBUKI" is accurate to a bias of ~0.3% with a standard deviation of ~0.7%, from the global mean atmospheric methane concentration (global average of 1.82 ppm in 2012 (World Data Center for Greenhouse Gases)).
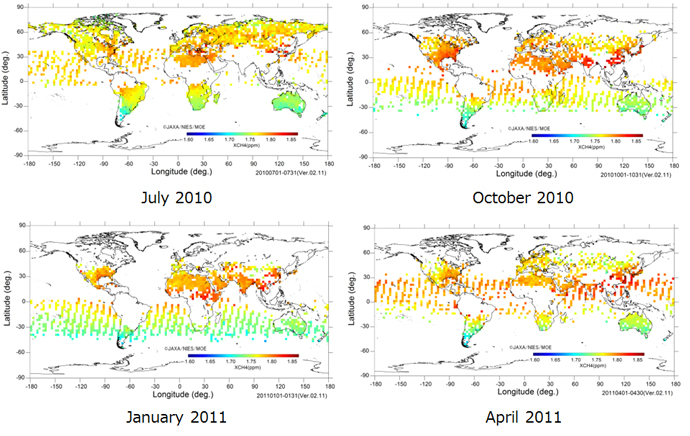
Figure 1 shows an example of global distribution of the monthly column-averaged methane concentrations acquired by "IBUKI". It shows that methane concentrations have seasonal variations according to their location in the Northern Hemisphere, and that methane concentrations in the Northern Hemisphere are higher than those in the Southern Hemisphere over the course of a year.
(2) Results of methane flux estimates using both ground-based observations and IBUKI observational data
Methane is emitted from a variety of sources, widely distributed throughout the globe. Additionally, there are temporal and spatial variations in source strengths. As such, the surface observation network, consisting of approximately 100 observation sites, is not sufficient to quantitatively estimate the temporal and spatial distributions for the net flux of methane. For the current study, by adding the observational data on methane concentration as acquired by "IBUKI" to the measurements from the ground-based observation network5, the monthly net fluxes of methane (hereafter "Net Flux") were estimated over 43 regions for 24 months (June 2009 – May 2011).
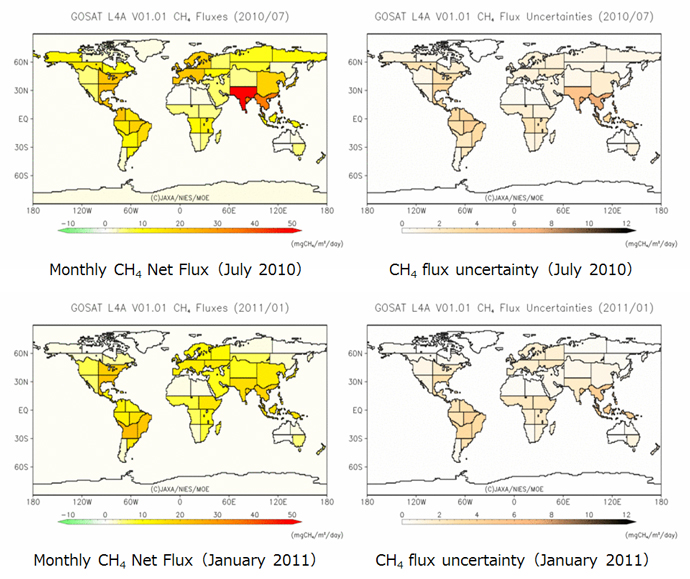
Figure 2 shows an example of monthly Net Flux estimates per region6 and their uncertainties. These results were obtained using an atmospheric transport model7 and an inverse model8, developed by NIES using the column-averaged methane concentrations based on the data acquired by "IBUKI" and the ground-based observation network. Figure 2 shows that there is a temporal variation in the regions which exhibit high emissions levels.
(3) Characteristics of the estimated annual flux of methane using observational data acquired by "IBUKI"
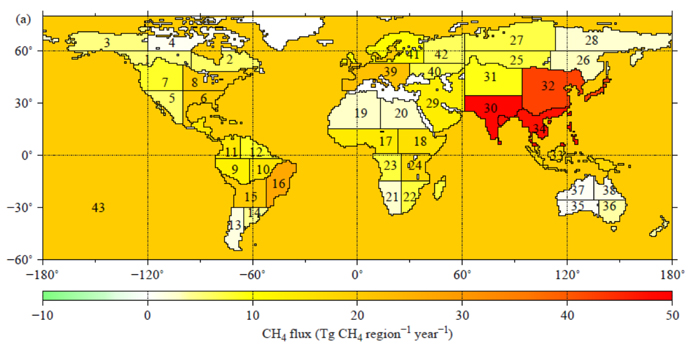
The annually averaged fluxes were calculated from the monthly regional estimates (Figure 3, two-year mean). The results show that several regions are responsible for high levels of methane emissions, and these are mostly consistent with areas of high population. Southeast Asia and the southern subtropics of South America and Africa are among the major methane emitters.
Methane is emitted from a wide variety of sources, including rice fields; wetlands; livestock; forest fires; and fossil fuel consumption - and is dissolved by chemical reactions with the OH radical9 in the air, or chlorine and excited oxygen atoms in the stratosphere. At present, methane emissions of anthropogenic origin are considered to be those of the greatest significance. Further methane emissions from permafrost thaw or large-scale forest fires are expected to accompany future global warming. It is thus imperative to monitor changes in concentrations and the Net Flux of methane.
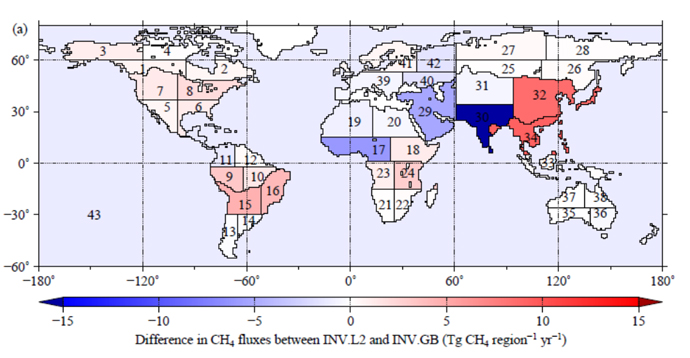
Estimations of annual methane emissions, which make use of the observational data acquired by "IBUKI" together with that from ground-based observations were higher than those produced using ground-based observations alone - in particular for Southeast Asia and the southern subtropical areas of South America and Africa (Figure 4). Moreover, there are differences in the seasonal variations of Net Flux for the estimates in some regions (not shown). Consequently, this indicates that "IBUKI" could potentially fill in the blanks left by the existing surface observation network, leading to new information about methane flux which cannot be attained using ground-based observations alone, in particular for the subtropical areas. "IBUKI" data is expected to provide further observational data of relevance to global carbon cycle studies - for instance which could improve a land ecosystem flux database with regards to methane emissions.
2. Further Steps
The present estimates of methane fluxes over the 43 regions throughout the globe will be evaluated by researchers in related fields, approved as Principle Investigators under the GOSAT Research Announcements, and through comparisons with similar estimates by other overseas institutes. Following the conclusion of this process, the present methane flux estimates will be publicly disseminated by the Three Parties this summer.
(pl.) A portion of the content of this release was produced under the grant-funded project "Characterization and Quantification of global methane emissions by utilizing GOSAT and in-situ measurements by the MOE Environment Research and Technology Development Fund" (ERTDF) A-1202.
Notes
Note 1: Sink and emissions aggregate (difference in total levels of sink and those of emissions) including sink by chemical reaction with the OH radical in the atmosphere; sink in the stratosphere; absorption by land; emissions from rice fields, wetlands, livestock, forest fires, energy/industry, etc.
Note 2: The unit "mgCH4 m-2 day-1" denotes the amount of methane (in milligram) per square meter per day absorbed or emitted in the target region.
- What's New
- What's New 2025
- What's New 2024
- What's New 2023
- What's New 2022
- What's New 2021
- What's New 2020
- What's New 2019
- What's New 2018
- What's New 2017
- What's New 2016
- What's New 2015
- What's New 2014
- What's New 2013
- What's New 2012
- What's New 2011
- What's New 2010
- What's New 2009
- What's New 2008
- What's New 2007
- What's New 2006
- What's New 2005
- What's New 2004
- What's New 2003
- What's New 2002
- Event Information
- Visit NIES