
Annual increase of whole-atmosphere mean concentration of carbon dioxide in 2024 was the largest in the past 14 years: preliminary results from the “IBUKI” (GOSAT) satellite
Distributed simultaneously to the Tsukuba Science City Press Club, the Ministry of the Environment Press Club, and the Environment Press Club.
The Secretary-General of the United Nations António Guterres stated in 2023, “The era of global warming has ended; the era of global boiling has arrived.” His remarks reflect the fact that climate change is an issue of great concern to all humankind and has become increasingly serious in recent years. The World Meteorological Organization (WMO) has confirmed that the global annual average temperature has increased since the 1970s and reached a new record high in 2024, when it rose to 1.5℃ above the pre-industrial level and therefore exceeded the goal of the Paris Agreement. Because the temperature rise fluctuates from year to year, medium–to–long-term trends should be confirmed. It is therefore unclear whether the temperature will continue to exceed the goal of the Paris Agreement, but last year’s rise should be regarded with a sense of urgency. The deviation of Japan’s average temperature in 2024 from the baseline (the 30-year average from 1991 to 2020) was +1.48℃, the warmest since records began to be kept in 1898. It will therefore be necessary to improve the monitoring of climate change in the future.
Press release by the WMO: https://wmo.int/news/media-centre/wmo-confirms-2024-warmest-year-record-about-155degc-above-pre-industrial-level (Connect to an external site)
Japan’s annual average temperature by the Japan Meteorological Agency (JMA):
https://www.data.jma.go.jp/cpdinfo/temp/an_jpn.html (Connect to an external site) [Japanese only]
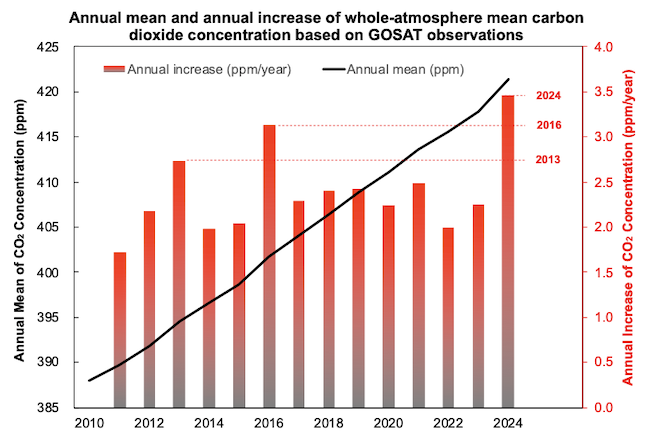
The National Institute for Environmental Studies (NIES), the Ministry of the Environment of Japan (MOE), and the Japan Aerospace Exploration Agency (JAXA) have been jointly promoting the development and operation of the Greenhouse gases Observing SATellite Series (GOSAT Series) to monitor the concentrations of greenhouse gases in the atmosphere, especially carbon dioxide and methane. Increases of the concentrations of those gases have been primarily responsible for global warming. The observations by “IBUKI” (GOSAT), the first satellite in the GOSAT Series, have revealed that the annual increase of the whole-atmosphere mean concentration of carbon dioxide (i.e., the average concentration throughout Earth’s atmosphere) from 2023 to 2024 was 3.5 ppm, the largest annual increase since 2011, when it first became possible to calculate the annual increase based on GOSAT observations.
Figure 1 and Table 1 show the trends in the whole-atmosphere annual mean concentration of carbon dioxide from 2010 to 2024 and the annual increase from 2011 to 2024 based on GOSAT observations. Although the whole-atmosphere mean concentration of carbon dioxide was 388 ppm in 2010, it has increased gradually since then and exceeded 421 ppm in 2024. The average annual increase over the past 14 years was 2.4 ppm per year, but it peaked at 3.5 ppm per year in 2024. That increase exceeded the previous largest annual increase of 3.1 ppm in 2016.
The conditions that caused the increase from 2023 to 2024 to exceed all of the annual increases during the previous 14 years may have included the following: high temperatures and droughts caused by the El Niño of 2023–2024; increased emissions of carbon dioxide and decreased areas of terrestrial vegetation and rates of photosynthesis due to forest fires; and increased anthropogenic emissions of carbon dioxide. To clarify the causes of the increase, a detailed analysis will be conducted based on not only the GOSAT data obtained during 2024 but also the entire GOSAT Series data.
El Niño Monitoring and Outlook by JMA:
https://ds.data.jma.go.jp/tcc/tcc/products/elnino/elmonout.html (Connect to an external site)
Main Message of “Global Carbon (Carbon Dioxide) Budget 2024” by the Global Carbon Project, Tsukuba International Office:
https://cger.nies.go.jp/gcp/pdf/20241113/GCB%202024%20press%20release_FINAL.pdf (Connect to an external site)
NIES, MOE, and JAXA will continue to monitor climate change by utilizing the GOSAT Series dataset and will disseminate the information to the international community.
| Year | 2010 | 2011 | 2012 | 2013 | 2014 | 2015 | 2016 | 2017 |
|---|---|---|---|---|---|---|---|---|
| Annual mean (ppm) | 388.0 | 389.7 | 391.9 | 394.6 | 396.6 | 398.6 | 401.8 | 404.0 |
| Annual increase (ppm/year) | 1.7 | 2.2 | 2.7 | 2.0 | 2.0 | 3.1 | 2.3 | |
| Year | 2018 | 2019 | 2020 | 2021 | 2022 | 2023 | 2024 | |
| Annual mean (ppm) | 406.5 | 408.9 | 411.1 | 413.6 | 415.6 | 417.9 | 421.3 | |
| Annual increase (ppm/year) | 2.4 | 2.4 | 2.2 | 2.5 | 2.0 | 2.3 | 3.5 |
Annotations
GOSAT Series
The GOSAT Series is an Earth observation satellite project jointly promoted by NIES, MOE, and JAXA. The main purpose of this endeavor has been to observe from space the atmospheric concentrations of carbon dioxide and methane, the major greenhouse gases. The first satellite in the series, the Greenhouse gases Observing Satellite “IBUKI” (GOSAT), was launched in 2009, and the second satellite, GOSAT-2 (IBUKI-2) was launched in 2018. Both satellites are currently in operation and have accumulated observational data for over 15 years. A third satellite, the Global Observing SATellite for Greenhouse gases and Water cycle (GOSAT-GW), is scheduled to be launched in Japan’s fiscal year 2025. Details about each satellite can be found on the following websites:
https://www.gosat.nies.go.jp
https://www.gosat-2.nies.go.jp
https://gosat-gw.nies.go.jp
Characteristics and significance of the GOSAT Series of carbon dioxide observations
Several meteorological agencies around the world, including the WMO, have reported the surface concentrations of carbon dioxide observed at various ground-based stations, as well as the global mean concentrations calculated from these observations. However, because the concentration of carbon dioxide varies with altitude, the data from ground-based stations alone are not equal to the concentrations throughout Earth’s atmosphere.
In contrast, the concentrations in the GOSAT Series are the average carbon dioxide concentrations from Earth’s surface to the top of the atmosphere; they are not just the carbon dioxide concentrations near the surface. The future concentration of carbon dioxide cited in the Intergovernmental Panel on Climate Change report and elsewhere is the mean concentration of the “whole atmosphere.” It is therefore important in calculating and predicting the risk of global warming due to future increases of carbon dioxide concentrations to calculate the mean concentrations of carbon dioxide over the entire Earth, and it is essential to understand that the “whole-atmosphere” includes the upper atmosphere.
Whole-atmosphere mean concentration
The whole-atmosphere mean concentration of carbon dioxide based on GOSAT observations is calculated from two standard products of GOSAT: the L2 CO2 column amount (SWIR) and L4B global CO2 distribution. The calculations take into consideration the effects of clouds and distributions of the ocean and land. Ground-based observational data are also used to validate and correct these products. The calculated results of the whole-atmosphere mean concentration (carbon dioxide) are publicly available at the following web site:
https://www.gosat.nies.go.jp/en/recent-global-co2.html
The following web sites provide details about the calculation of whole-atmosphere mean concentrations:
https://www.gosat.nies.go.jp/newpdf/Appendix_Press_20160929.pdf
https://www.gosat.nies.go.jp/en/assets/2311_wam_biases_02c_en.pdf
“Annual mean concentration” and “annual increase”
The “annual mean concentration” in this press release refers to the simple average of the monthly values of whole-atmosphere concentrations over a 12-month period based on GOSAT observations. The “annual increase” refers to the increase of the annual mean concentration from one year to the next. For example, “the annual increase from 2010 to 2011” is calculated by subtracting the “annual mean concentration in 2010” from the “annual mean concentration in 2011”. Please note that data on annual mean concentrations are available only from 2010 and subsequent years, and data on annual increases are available since 2011 because observations by GOSAT were begun in April 2009.
Related press releases
1.“Public release of whole-atmosphere monthly mean carbon dioxide concentration based on observations by Greenhouse gases Observing SATellite "IBUKI" (GOSAT)” (November 2015)
https://www.nies.go.jp/whatsnew/20151116/20151116-e.html
2.“Whole-atmospheric monthly CO2 concentration tops 400 ppm – Preliminary GOSAT monitoring results –” (May 2016)
https://www.nies.go.jp/whatsnew/20160520/20160520-e.html
3.“Whole-atmosphere monthly mean CO2 concentration detrended with average seasonal variation tops 400 ppm! - Preliminary GOSAT monitoring results –” (October 2016)
https://www.gosat.nies.go.jp/en/news/20161027pressrelease.html
4.Public release of whole-atmosphere mean methane concentration based on observations by Greenhouse gases Observing SATellite "IBUKI" (GOSAT)” (June 2017)
https://www.nies.go.jp/whatsnew/20170602/20170602.html (in Japanese)
5.“Annual increase in whole-atmosphere mean methane concentration for 2021 marks the largest since 2011—based on Greenhouse gases Observing SATellite “IBUKI” (GOSAT) observations” (March 2022)
https://www.nies.go.jp/whatsnew/20220323/20220323-e.html
Contacts
[Contact for this research]
Tsuneo Matsunaga, Director
Satellite Observation Center
National Institute for Environmental Studies
[Contact for this press release]
Public Relations Office, Planning Division
National Institute for Environmental Studies
Email: kouhou0 (please append ‘@nies.go.jp’ to complete the email address)
- What's New
- What's New 2025
- What's New 2024
- What's New 2023
- What's New 2022
- What's New 2021
- What's New 2020
- What's New 2019
- What's New 2018
- What's New 2017
- What's New 2016
- What's New 2015
- What's New 2014
- What's New 2013
- What's New 2012
- What's New 2011
- What's New 2010
- What's New 2009
- What's New 2008
- What's New 2007
- What's New 2006
- What's New 2005
- What's New 2004
- What's New 2003
- What's New 2002
- Event Information
- Visit NIES