Estimation of autumn oxygen emissions from the Pacific Ocean from atmospheric observations

1. Background and objective of this study
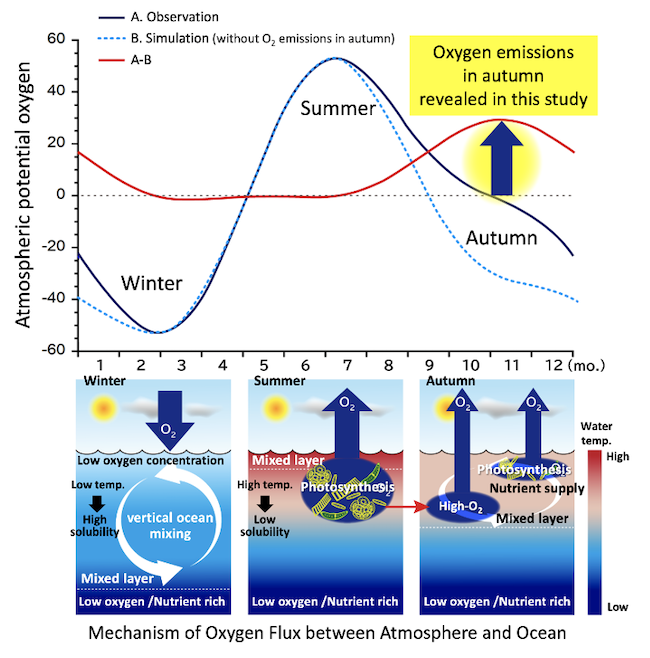
In recent years, development of precise methods for measuring oxygen (O2) concentrations have allowed us to detect change in the atmospheric O2 concentrations. Global atmospheric O2 observation programs have revealed that the spatiotemporal variations in O2 concentrations can provide information on various processes on the Earth’s surface including the global carbon cycles. One of such information that the atmospheric O2 observations can provide us is the gas exchange between the atmosphere and the ocean. In spring and summer, O2 produced during photosynthesis (primary production) by phytoplankton at the ocean surface is released into the atmosphere. In autumn and winter, the surface cooling enhances the vertical ocean mixing, which brings the deeper water with depleted O2 to the surface, resulting in the absorption of atmospheric O2 into the ocean. The seasonal change in the sea surface temperature, causing the O2 solubility change, enhances the above seasonal change in the ocean O2 flux. The seasonal variation in atmospheric O2 concentrations reflects the changes in the O2 flux from the terrestrial biosphere and the above-mentioned O2 flux from the ocean, and shows seasonal variations with a maximum in summer and a minimum in winter. Additionally, it has been pointed out that O2 may be released from the ocean in autumn. There are two tentative mechanisms for such autumn O2 emissions. One mechanism is outgassing from ocean subsurface layer, rich in dissolved O2, associated with the increasing mixed layer depth. The other one is O2 outgassing from phytoplankton bloom in autumn. The possibility of O2 release in autumn due to these mechanisms has long been pointed out, but it has not been clear which ocean areas and to what extent it actually occurs.
A research team led by Yasunori Tohjima of the Earth System Division of the National Institute for Environmental Studies and Kazuhiro Tsuboi of the Meteorological Research Institute of the Japan Meteorological Agency (hereinafter referred to as "our research team") has been conducting wide-area observations of atmospheric O2 concentrations in the Asia-Pacific region. Therefore, in this study, we aimed to clarify the spatial distribution of seasonal variations in atmospheric O2 concentrations in the Pacific Ocean and to explore the possibility of O2 emission from the ocean in autumn through a detailed comparison of the atmospheric O2 seasonal cycles between the observation and the model simulation based on previously reported ocean O2 fluxes and an atmospheric transport model.
2. Research Methodology
Measurement of atmospheric oxygen concentration and APO (Atmospheric Potential Oxygen)
Our research team developed an original method to precisely measure the O2 concentration in air samples using a gas chromatograph and a thermal conductivity detector, and has been observing atmospheric O2 concentrations since the late 1990sNote 1. In addition, a non-dispersive infrared analyzer (NDIR) was used to determine the atmospheric carbon dioxide (CO2) concentration. In this study, to conduct an analysis focusing on the air-sea gas exchange, we used atmospheric potential oxygen (APO), which is defined as the sum of atmospheric O2 and CO2 Note 2. APO, being defined to be unchanged by the exchange of O2 and CO2 in the terrestrial biosphere, is a tracer that mainly reflects the O2 exchange between the atmosphere and the ocean.
Flask sampling of air samples in the Asia-Pacific region
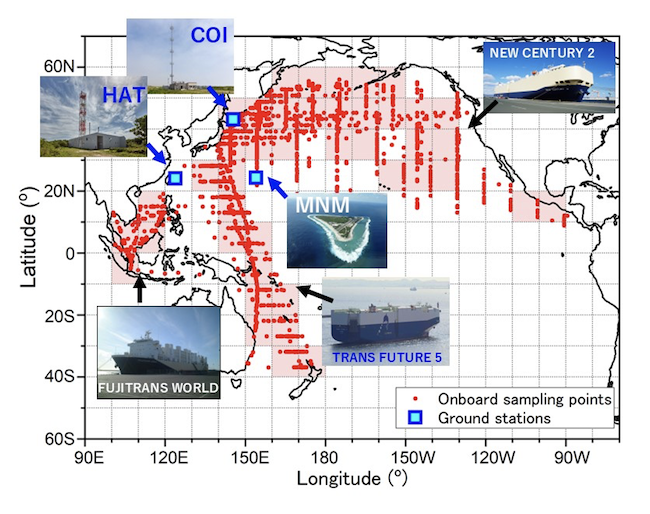
In order to clarify the spatiotemporal variations of atmospheric O2 concentrations over a wide area of the Asia-Pacific region, our research team conducted flask sampling of air samples using cargo ships operating between Japan and North America, Oceania, and Southeast Asia, as well as ground stations at Hateruma Island, Ochiishi Cape, and Minamitorishima. Figure 1 shows the distribution of flask sampling points. Since sampling was conducted on the route, air samples were collected in the Western Pacific and North Pacific. In this study, to obtain detailed spatial distribution of the average seasonal variation of APO, the data from the cargo ships was grouped into 10º latitude × 10º longitude bins, and the spatial distribution of the average seasonal variation in the western Pacific and North Pacific was obtained. The 41 pink-shaded bins in Figure 1 are the locations where the seasonal variation could actually be obtained.

Simulation of seasonal cycle based on an atmospheric transport model
In this study, APO was simulated using the ocean O2 and CO2 fluxesNote 3 and an atmospheric transport model (NIES-TM), and the simulated seasonal variation was compared in detail with the observed ones. The climatological monthly ocean O2 fluxes used for the simulation were taken from an empirical product that relates O2 flux to ocean heat flux (Garcia & Keeling, 2001; hereafter “GK2001 O2 fluxes”). Previous studies have shown that the GK2001 O2 fluxes reproduce the seasonal variation of APO well, but the autumn flux has not been explicitly considered.
A function expressed as the sum of a quadratic equation corresponding to the long-term trend and two harmonics with periods of 1 year and 1/2 year was fitted to the observed and simulated APO by using a least squares method. The average seasonal cycle was obtained as the sum of the two harmonics.
3. Results and discussion
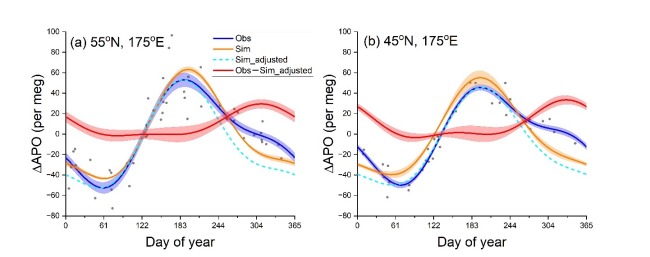
Figure 2 shows typical examples of APO seasonal cycle derived from air samples collected onboard cargo ships in the two 10º x 10º bins. The simulated seasonal APO cycles based on the GK2001 flux (orange line) reproduces the observed seasonal cycles (blue line) well. However, detailed comparison shows some differences in amplitude and phase. Furthermore, focusing on the decrease in APO from summer to winter, we found that the observed results tend to decrease more slowly than the simulation results in the mid- and high-latitude zones of the Northern Hemisphere.

The differences in amplitude and phase may reflect those of the GK2001 O2 fluxes used in the simulation. Since the primary objective of this study is to investigate the difference in the seasonal pattern between the observation and simulation, differences in the amplitude and phase of the seasonal cycle must be minimized. Therefore, the simulated seasonal cycle is scaled by a single factor and shifted by the phase difference to match the observations. The results are shown in the light blue dashed lines in Figure 2, which reproduce better the observed seasonal cycles. The red curve shows the difference (observation – adjusted simulation) between the observation (red curve) and the adjusted simulation (light blue dashed line). The difference shows almost zero except during autumn-winter period, when a peak-like increase (apparent autumn peak) is observed. These results suggest the existence of autumn O2 flux that is not expressed in the GK2001 flux.
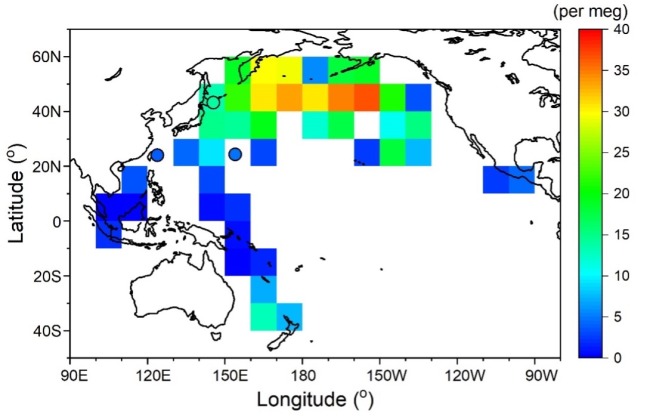
Fig. 3 shows the spatial distribution of the amplitude of the apparent autumn peaks. There are prominent enhancements of the apparent autumn peaks except the equatorial region (20S-20N), especially north of 40N. A time series of vertical profiles of dissolved O2 concentrations in the Pacific Ocean at 20-40ºS and 20-40ºN showed that a subsurface shallow oxygen maximum appeared at a depth of about 60m in summer and disappeared in autumn and winter. Meanwhile, a study based on satellite observations of chlorophyll a concentration (an index of phytoplankton abundance) suggested that the 40-60ºN in the Pacific Ocean is where autumn blooms occur. These facts suggested the possibility of O2 emission from the subsurface oxygen maximum in the 20-40ºS and 20-40ºN latitudes, and from the autumn bloom in the 40-60ºN latitudes.

4. Future prospect
In this study, we were unable to quantitatively estimate the intensity and distribution of ocean O2 fluxes in autumn. However, in the future, such quantitative estimation will be conducted by inverse analyses using an atmospheric transport model. Since ocean O2 flux is closely related to marine biogeochemical processes and circulation, deepening our knowledge about air-sea O2 exchange is expected to contribute to the analysis of variations in atmospheric O2 concentration and the development of marine biogeochemical models.
5. Note
1 Changes in the atmospheric O2 concentration are expressed as relative deviations of the O2 to nitrogen (N2) ratio in the atmosphere from an arbitrary reference air according to the following equation:
δ(O2/N2)={(O2/N2)sam/(O2/N2)ref-1}×106 (1)
where the subscripts “sam” and “ref” represent “sample” and “reference”, respectively. The unit of “per meg” is used to express the δ(O2/N2) value. A change of 4.77 per meg corresponds to a change of 1 ppm in the trace component.
2 Atmospheric potential oxygen (APO) is defined by the following equation:
APO=O2+αB×CO2 (2)
where αB represents the exchange ratio of O2 and CO2 in the terrestrial biosphere. Since O2/N2 ratio is used to express the O2 concentration change as is described in Note 1, APO is calculated as follows:
δAPO=δ(O2 /N2)+αBXCO2 /XO2)-1850 (3)
3 Since the APO measurements are calculated as the sum of δ(O2/N2) and CO2 concentrations as shown in equation (3), the ocean N2 fluxes are also used in addition to the ocean O2 and CO2 fluxes to simulate APO. Furthermore, since the APO is also affected by fossil fuel combustion, the CO2 flux from fossil fuels is also used in the calculation.
6.Funding
This study was supported by funds provided by a Grant-in-Aid for Scientific Research (S) (KAKENHI) of the Japan Society for the Promotion of Science (Grant Number 22H05006) and the Global Environmental Research Coordinate System from the Ministry of the Environment, Japan (grant no. E1951).
7. About the article
【Article title】 Observed APO Seasonal Cycle in the Pacific: Estimation of Autumn O2 Oceanic Emissions 【Authors】 Yasunori Tohjima, Tomoko Shirai, Misa Ishizawa, Hitoshi Mukai, Toshinobu Machida, Motoki Sasakawa, Yukio Terao, Kazuhiro Tsuboi, Shintaro Takao, Shin-ichiro Nakaoka 【Journal】Global Biogeochemical Cycles 【URL】https://agupubs.onlinelibrary.wiley.com/doi/full/10.1029/2024GB008230 【DOI】10.1029/2024GB008230
8.Author of this press release
National Institute for Environmental Studies
Earth System Division
Biogeochemical Cycle Observation Section
Specially Appointed Researcher Yasunori Tohjima
Guest Researcher Hitoshi Mukai
Senior Researche Yukio Terao
Center for Global Environmental Research
Office for Global Environmental Data Integration and Analytics
Head Tomoko Shirai
Guest Researcher Misa Ishizawa1)
Center for Global Environmental Research
Office for Atmospheric and Oceanic Monitoring
Head Toshinobu Machida
Chief Senior Researcher Motoki Sasakawa
Senior Researcher Shin-ichiro Nakaoka
Senior Researcher Shintaro Takao
Meteorological Research Institute
Department of Climate and Geochemistry Research
Head Kazuhiro Tsuboi2)
1) Environment and Climate Change Canada
2) Now at Japan Meteorological Agency, Atmosphere and Ocean Department
9. Contact
National Institute for Environmental Studies
Earth System Division
Yasunori Tohjima
National Institute for Environmental Studies
Planning Division, Public Relations Office
Email: kouhou0 (please append @nies.go.jp to this address)
- What's New
- What's New 2025
- What's New 2024
- What's New 2023
- What's New 2022
- What's New 2021
- What's New 2020
- What's New 2019
- What's New 2018
- What's New 2017
- What's New 2016
- What's New 2015
- What's New 2014
- What's New 2013
- What's New 2012
- What's New 2011
- What's New 2010
- What's New 2009
- What's New 2008
- What's New 2007
- What's New 2006
- What's New 2005
- What's New 2004
- What's New 2003
- What's New 2002
- Event Information
- Visit NIES