Study on consistency of greenhouse gas concentrations between GOSAT and GOSAT-2
- Efforts to develop long-term data sets on greenhouse gas concentrations using the GOSAT series -
This result is expected to lead to further utilization of greenhouse gas concentration data obtained by the GOSAT series.
The result of this study was published in the online journal of the Meteorological Society of Japan “SOLA (Scientific Online Letters on the Atmosphere)” on August 22, 2023.
1. Background and objectives
The Ministry of the Environment of Japan, the National Institute for Environmental Studies (NIES), and the Japan Aerospace Exploration Agency are jointly promoting the GOSAT series, a series of Earth observation satellites whose main purpose is to observe greenhouse gases from space; the Greenhouse gases Observing SATellite (GOSAT) launched in January 2009 and GOSAT-2 launched in October 2018 are currently in operation, and the Global Observing SATellite for Greenhouse gases and Water cycle (GOSAT-GW) is planned to be launched in Japan’s FY2024. NIES is responsible for developing and improving the retrieval algorithms of greenhouse gas concentrations for data observed by the GOSAT series, and validation and quality evaluation of the retrieval results.
GOSAT and GOSAT-2 are equipped with the greenhouse gas observation sensors the Thermal And Near-infrared Sensor for carbon Observation – Fourier Transform Spectrometer (TANSO-FTS) and TANSO-FTS-2, respectively. The column-averaged dry air mole fractions(*1) of carbon dioxide (CO2) and methane (CH4) have been retrieved from the Short-Wavelength InfraRed (SWIR) spectra(*2) observed by these sensors, and the retrieval results are released as Level 2 products by NIES. The validation and quality evaluation of the retrieved concentration data have been conducted for each satellite using data from the ground-based Fourier transform spectrometer observation network TCCON(*3), but comparison of the concentration data among satellites has not been conducted so far. In developing long-term concentration data sets by GOSAT series, it is important to ensure the inter-satellite data consistency. In this study, we compared CO2 and CH4 concentration data obtained from the two GOSAT series satellites to investigate the extent to which systematic differences in the concentration data between satellites vary temporally and/or spatially.
2. Methodology
The greenhouse gas concentration retrieval algorithm developed by NIES is designed to improve the retrieval accuracy and precision by taking into account the effects of aerosols scattering and changes in instrument characteristics that can cause errors in the retrieved concentrations(*4). However, there are always some differences between the information used in the analysis and reality, causing errors in the concentration data. During the validation activities, empirical bias correction methods using multiple regression analysis (an analytical technique that derives a relational equation to explain one data set with two or more other data sets) have been developed and evaluated, and bias-corrected Level 2 products for GOSAT have been released. Since those for GOSAT-2 have not been released, bias correction using the multiple regression analysis is applied to GOSAT-2 data in this study.
For bias-corrected CO2 and CH4 concentration data, the following analyses are conducted.
(1) Comparison of TCCON data with each satellite data
(2) Comparison of GOSAT and GOSAT-2 synchronous observation data
(3) Comparison of monthly mean concentrations in the 10° latitude x 10° longitude area for GOSAT and GOSAT-2
In order to reduce the influence of temporal and spatial heterogeneity of each gas concentration on the evaluation results, data satisfying the following match-up conditions are selected for comparisons in (1) and (2).
<Match-up condition for (1)>
The center of the satellite FTS instantaneous field of view (IFOV) must be within ±0.2° latitude-longitude box centered on the TCCON site.
The difference between the mean altitude within the satellite FTS IFOV and the altitude of the TCCON site must be less than 200 meters.
TCCON observation data must exist within ±30 minutes of the satellite observation time.
<Match-up condition for (2)>
GOSAT data and GOSAT-2 data must be observed on the same date.
The center of the FTS IFOV of one satellite must be within ±0.2° latitude-longitude box centered on the center of the other satellite FTS IFOV, and the data are nearest neighbors of each other.
The difference of the mean altitude within the FTS IFOV of each other’s data must be less than 200 meters.
The data periods used in the analysis are April 2009 to November 2022 for GOSAT, March 2019 to November 2022 for GOSAT-2, and April 2009 to December 2020 for TCCON, and comparisons are made for the periods for which both data sets exist.
3. Results and discussion
First, (1) a comparison of TCCON data and each satellite data is presented. All satellite data that met the match-up criteria are land data. Due to differences in satellite operation periods and sensor operation patterns, there are 14 TCCON sites for GOSAT and 13 sites for GOSAT-2 for which more than 20 match-up data are obtained. According to the average and standard deviation of the difference between the satellite data and TCCON data calculated for these TCCON sites (hereinafter referred to as “site bias” and “single measurement precision”, respectively), the averaged single measurement precision values for both GOSAT and GOSAT-2 are less than 1.9 ppm for CO2 and less than 10 ppb for CH4, and the site-to-site bias, defined as the standard deviation of the site bias and representing its regional dependence, is found to be less than 0.9 ppm for CO2 and less than 5 ppb for CH4.
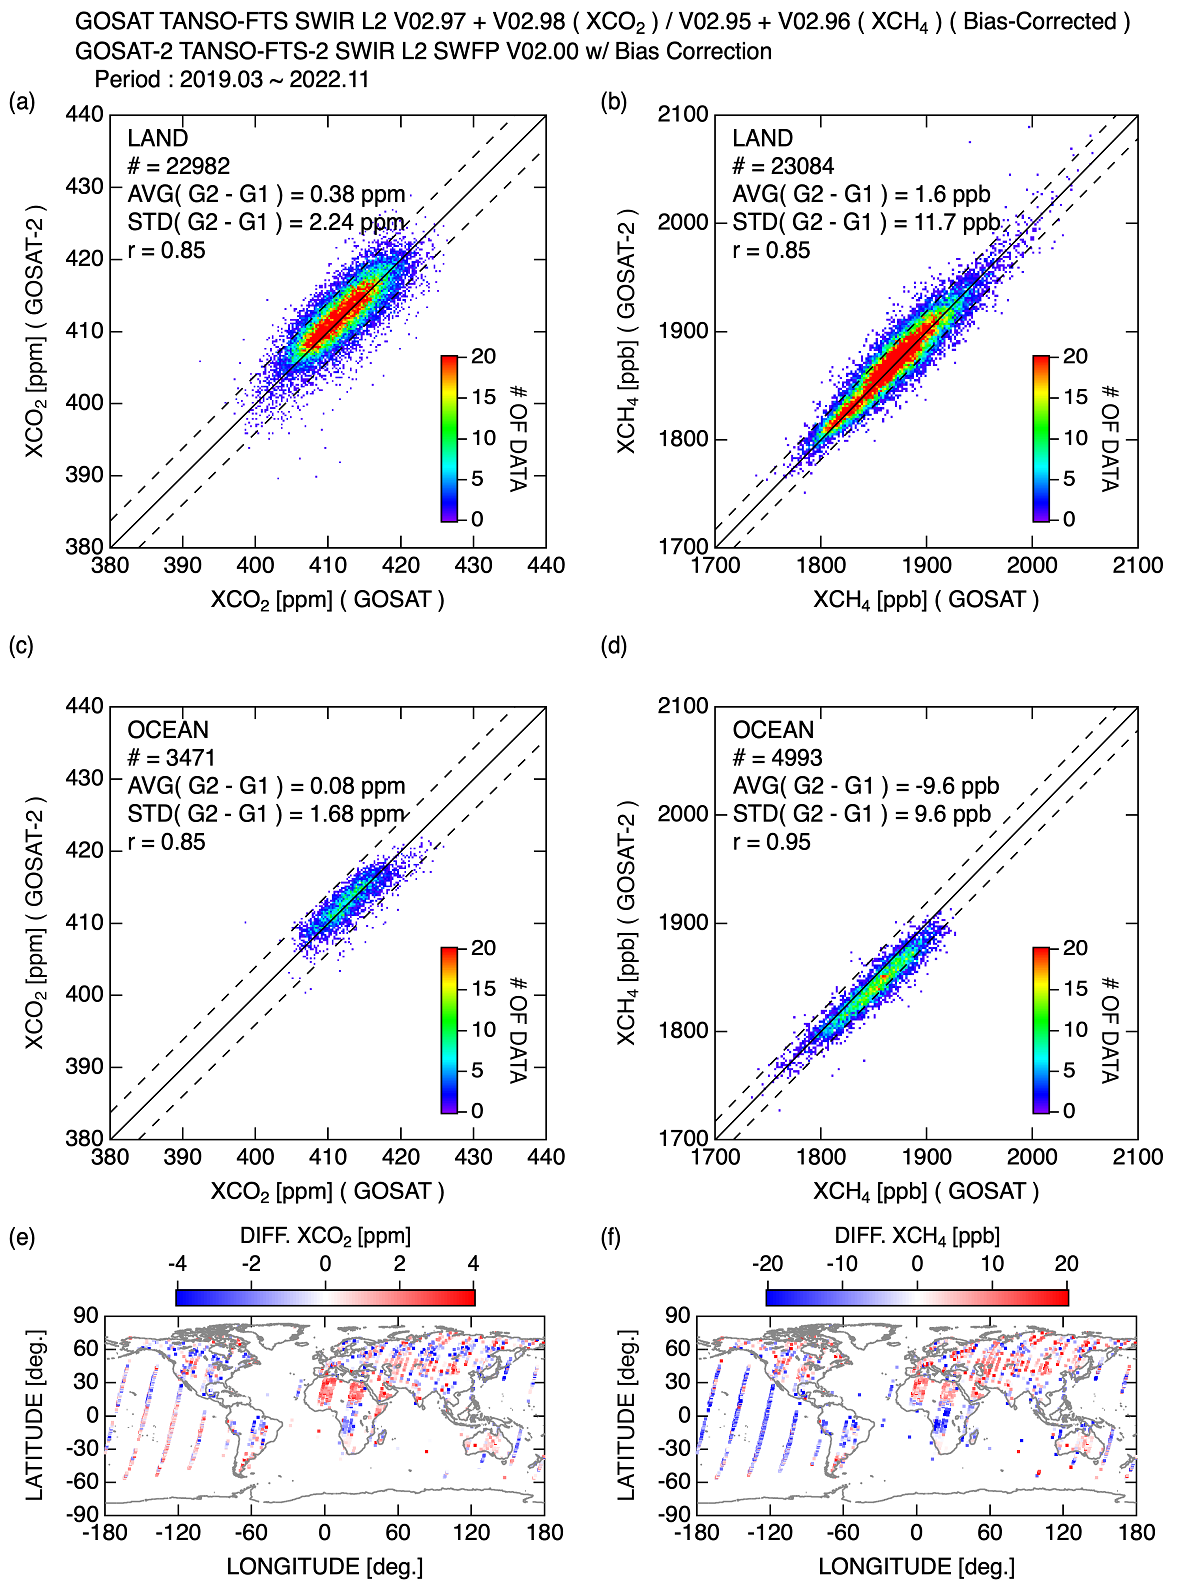
Next, (2) a comparison of GOSAT and GOSAT-2 synchronous observation data is presented (Figure 1). Although the difference in the satellite revisit cycles(*5) (3 days for GOSAT and 6 days for GOSAT-2) limits the areas where synchronous observations are possible, there are satellite data that met the match-up conditions not only over land but also over the ocean. The standard deviations of the difference between GOSAT and GOSAT-2 data are less than 2.24 ppm for CO2 and 11.7 ppb for CH4 for land data, and 1.68 ppm for CO2 and 9.6 ppb for CH4 for ocean data. These values are slightly smaller than the root sum square of the averaged single measurement precision for both satellites. However, CH4 over ocean of GOSAT-2 is about 10 ppb lower than that of GOSAT. This may be due to the differences in the treatment of land and ocean data. That is, the treatment of surface reflection in the retrieval analysis and multiple regression analysis for bias correction are different for land and ocean data for GOSAT, whereas they are identical for GOSAT-2.
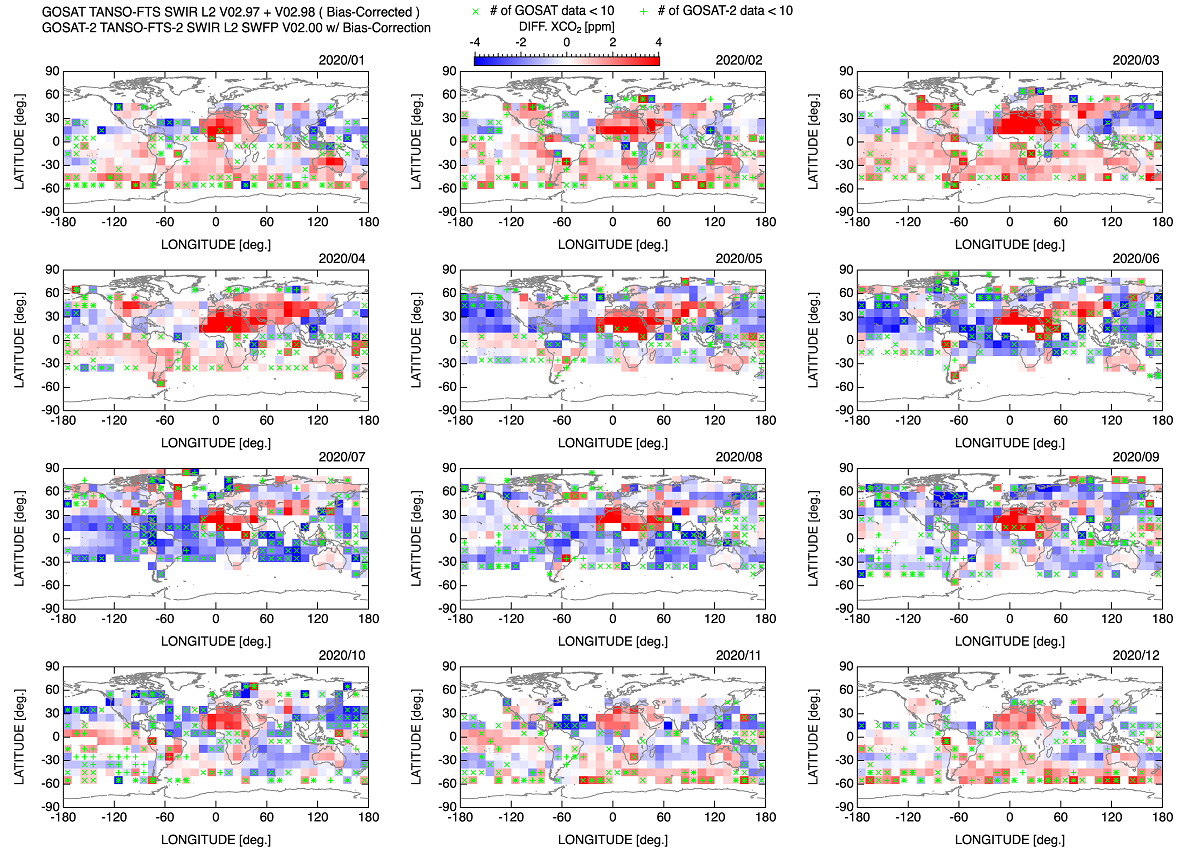
Finally, (3) a comparison of the monthly mean concentrations in every 10° latitude x 10° longitude area for GOSAT and GOSAT-2 is shown (Figure 2). Note that the regional monthly mean concentrations used for comparison are calculated for each satellite, using data observed by each satellite at different locations and on different dates, even within the same area and the same month. The difference in regional monthly mean concentrations between two satellites varies depending on the location and season. Although the cause of this difference is still under investigation, it may be partially due to the fact that the aerosol effects are not fully taken into account. For example, in North Africa, the mean concentration of GOSAT-2 is higher than that of GOSAT, but this is because the amount of aerosol simultaneously retrieved with gas concentrations is lower for GOSAT-2 than for GOSAT. The standard deviations of the differences in regional monthly mean concentrations calculated from more than 10 satellite data sets for GOSAT and GOSAT-2, respectively, are 1.77 ppm for CO2 and 11.7 ppb for CH4, which are larger than the site-to-site bias evaluated using the TCCON data. Because satellite observations cover the entire globe, the distribution of parameters that affect gas concentration retrieval, such as aerosols and surface reflection properties, is also diverse, but existing TCCON network covers only a limited area. In other words, the TCCON sites used in this study are insufficient in terms of covering the global diversity of satellite data and properly assessing the regional dependence of biases. It is important to obtain additional validation data that can extend the coverage of satellite observation conditions and regions, such as regions with high surface reflectance or ocean.
4. Outlook
The findings on the consistency between GOSAT and GOSAT-2 data obtained in this study are important to note when using these satellite data. We will continue our research to improve the accuracy and precision of each satellite data and the consistency among the satellite data in order to further enhance the convenience of the data. The results of this study are also expected to be helpful for the expansion of the TCCON network.
5. Annotations
6. Funding
The commissioned project by the Ministry of Environment of Japan supported parts of the TCCON measurements which are used in the validation studies. The Paris TCCON site has received funding from Sorbonne Université, the French research center CNRS, the French space agency CNES, and Région Île-de-France.
7. About the article
【Article Title】Quality Evaluation of the Column-Averaged Dry Air Mole Fractions of Carbon Dioxide and Methane Observed by GOSAT and GOSAT-2 【Authors】Yukio Yoshida, Yu Someya, Hirofumi Ohyama, Isamu Morino, Tsuneo Matsunaga, Nicholas M. Deutscher, David W.T. Griffith, Frank Hase, Laura T. Iraci, Rigel Kivi, Justus Notholt, David F. Pollard, Yao Té, Voltaire A. Velazco, and Debra Wunch 【Journal】Scientific Online Letters on the Atmosphere 【URL】https://www.jstage.jst.go.jp/article/sola/19/0/19_2023-023/_article/-char/en 【DOI】10.2151/sola.2023-023
8. Author of this press release
National Institute for Environmental Studies
Satellite Remote Sensing Section, Earth System Division
Yukio Yoshida (Senior Researcher)
Yu Someya (Senior Researcher)
Hirofumi Ohyama (Senior Researcher)
Isamu Morino (Head)
Satellite Observation Center, Earth System Division
Tsuneo Matsunaga (Director)
9. Contact
YOSHIDA Yukio
Earth System Devision, National Institute for Environmental Studies
- What's New
- What's New 2025
- What's New 2024
- What's New 2023
- What's New 2022
- What's New 2021
- What's New 2020
- What's New 2019
- What's New 2018
- What's New 2017
- What's New 2016
- What's New 2015
- What's New 2014
- What's New 2013
- What's New 2012
- What's New 2011
- What's New 2010
- What's New 2009
- What's New 2008
- What's New 2007
- What's New 2006
- What's New 2005
- What's New 2004
- What's New 2003
- What's New 2002
- Event Information
- Visit NIES