Development of a near-real-time estimation method for China's CO2 emissions from atmospheric observations —CO2/CH4 variability ratios observed on Hateruma and Yonaguni Islands reflect the emission ratio in China —
The results of this research will be published in "Progress in Earth and Planetary Science," a scientific journal in the field of earth and planetary science published by Springer on March 2, 2023.
1. Background and objective of this study
In the Paris Agreement adopted in December 2015, it was agreed to reach a balance between anthropogenic greenhouse gas emissions and removals by sinks in the second half of this century and to achieve net zero emissions. The degree of achievement of each country's reduction targets is usually validated based on an inventory obtained by aggregating various statistical data on greenhouse gas emissions. However, it is crucial to develop independent estimation methods for the emissions for tracking policy implementation.
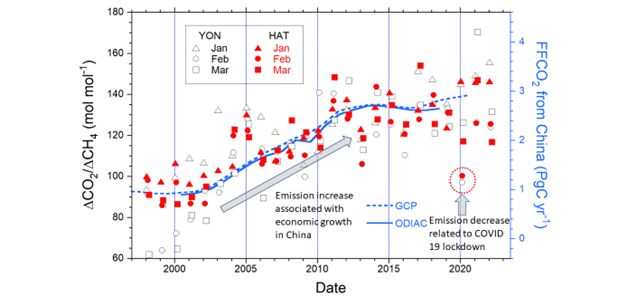
Analyzing atmospheric carbon dioxide (CO2) and methane (CH4) concentrations observed on Hateruma Island (HAT) and Yonaguni Island (YON)1), our research team, led by Yasunori Tohjima in the Earth System Division of the National Institute for Environmental Studies, had found that the variability ratio (ΔCO2/ΔCH4) in winter reflected the variations in the fossil fuel-related CO2 (FFCO2) emissions from China2, 3). The ΔCO2/ΔCH4 ratios showed a gradual increase during 2000-2010 and a marked decrease in February 2020 (Fig. 1). The former change reflected an unprecedented increase in FFCO2 emissions associated with the rapid economic growth in China, and the latter changes corresponded to the period of a severe lockdown implemented in China. Therefore, we revisited the ΔCO2/ΔCH4 ratios observed on both islands to develop a near-real-time estimation method for the temporal change in the FFCO2 emissions from China.
2. Development of the estimation method
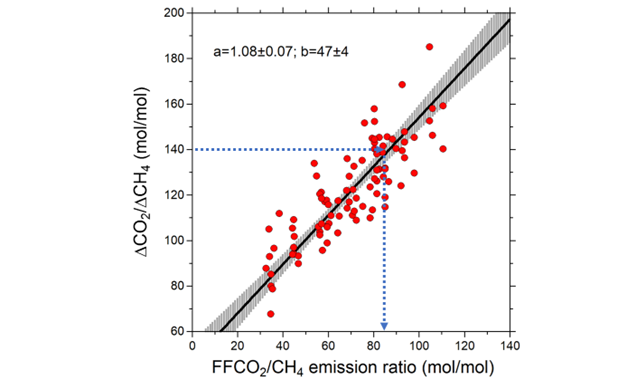
We simulated atmospheric CO2 and CH4 using an atmospheric transport model (NICAM-TM) and a full set of surface CO2 and CH4 fluxes and found a linear relationship between simulated ΔCO2/ΔCH4 ratios and FFCO2/CH4 emission ratios in China during January, February, and March (Fig. 2). Therefore, we could use this linear relationship to convert the observed ΔCO2/ΔCH4 ratios to FFCO2/CH4 emission ratios in China. Then, we calculated the change rate of the FFCO2/CH4 emission ratios compared to the corresponding averages for the preceding 9-year period (2011–2019), during which relatively stable ΔCO2/ΔCH4 ratios were observed. Under the additional assumption that there were no interannual variations in biospheric CO2 and CH4 fluxes, we can interpret the rate of change in the FFCO2/CH4 emission ratio as the rate of change in FFCO2 emissions from China. Finally, we computed the weighted averages of the estimated change rates for HAT and YON.
3. Results and discussion
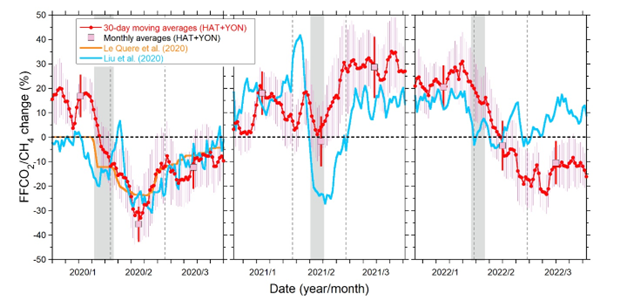
Using the method described above, we estimated the change in FFCO2 emissions from China for 2020, 2021, and 2022 compared to the preceding 9-year average (Fig. 3)4). The resulting changes in FFCO2 emissions for January, February, and March (JFM) were 17 ± 8%, −36 ± 7%, and −12 ± 8%, respectively, in 2020 (−10 ± 9% for JFM overall), 18 ± 8%, −2 ± 10%, and 29 ± 12%, respectively, in 2021 (15 ± 10% for JFM overall), and 20 ± 9%, −3 ± 10%, and −10 ± 9%, respectively, in 2022 (2 ± 9% for JFM overall). Our estimation results suggest that FFCO2 emissions from China, which decreased considerably during February 2020, rebounded with the recovery of socioeconomic activity in China after the COVID lockdown. However, the slight decrease in our estimated FFCO2 change in March 2022 suggests that the FFCO2 emissions from China were still being affected in 2022 by the COVID-19 infection status in China.
4. Future prospect
The estimation method developed in this study has some drawbacks: the estimated changes do not uniformly cover the emissions from all over China, the estimation period is limited to three months in winter, and the interannual variations in the CO2 emissions from the terrestrial biosphere and CH4 emissions would cause uncertainty. Nevertheless, this method is highly useful in the sense that changes in emissions can be estimated in quasi-real time with extremely simple calculations without collecting global observation data and performing large-scale atmospheric transport simulation analyses. Therefore, continuously adapting this method to the observed data at HAT and YON we will monitor future changes in FFCO2 emissions from China to validate the pledged reduction targets.
5. Note
1 Hateruma Island (HAT, 24.06N, 123.81E) and Yonaguni Island (YON, 24.47N, 123.01E) belong to the western part of the Ryukyu Islands, located between the East China Sea and the western Pacific. The National Institute for Environmental Studies (NIES) and the Japan Meteorological Agency (JMA) began monitoring of the atmospheric GHGs at HAT and YON in the 1990s. The details are given on the following website: http://db.cger.nies.go.jp/gem/ja/ground/ and 気象庁|温室効果ガス等の観測地点(与那国島) (jma.go.jp). 2 Tohjima Y, Patra PK, Niwa Y, Mukai H, Sasakawa M, Machida T (2020) Detection of fossil-fuel CO2 plummet in China due to COVID-19 by observation at Hateruma. Sci Rep 10: 18688. https://doi.org/10.1038/s41598-020-75763-6 3 Tohjima Y, Niwa Y, Tsuboi K, Saito K (2022) Did atmospheric CO2 and CH4 observation at Yonagunijima detect fossil-fuel CO2 reduction due to COVID-19 lockdown? J Meteor Soc Japan 100(2): 437-444. https://doi.org/10.2151/jmsj.2022-021 4 The FFCO2 emission estimates based on this method are given on a web page of the Environment Research and Technology Development Fund SII-8 Project (Comprehensive Study on Multiscale Monitoring and Modeling of Greenhouse Gas Budgets), 成果1-(2) | 環境研究総合推進費SII-8プロジェクト (nies.go.jp). 5 Friedlingstein P, et al. (2022) Glocal carbon budget 2021. Earth Syst Sci Data 14: 1917-2005. https://doi.org/10.5194/essd-14-1917-2022 6 Oda T, Maksyutov S (2011) A very high-resolution (1 km×1 km) global fossil fuel CO2 emission inventory derived using a point source database and satellite observations of nighttime lights. Atmos Chem Phys, 11, 543–556. 7 Le Quéré C, Peters GP, Friedlingstein P, Andrew RM, Canadell JG, Davis SJ, Jackson RB, Jones MW (2021) Fossil CO2 emissions in the post-COVID-19 era. Nat Clim Chang 11: 197-199. https://doi.org/10.1038/s41558-021-01001-0 8 Liu Z, et al. (2020) Near-real-time monitoring of global CO2 emissions reveals the effects of the COVID-19 pandemic. Nat Commun 11, 5172. https://doi.org/10.1038/s41467-020-18922-7
6. Funding
This study was supported by funds provided by the Environment Research and Technology Development Fund (JPMEERF21S20800) and the Global Environmental Research Coordinate System from the Ministry of the Environment, Japan (grant no. E1451).
7. About the article
【Article title】
Near-real-time estimation of fossil fuel CO2 emissions from China based on atmospheric observations on Hateruma and Yonaguni Islands, Japan
【Authors】
Yasunori Tohjima, Yosuke Niwa, Prabir K. Patra, Hitoshi Mukai, Toshinobu Machida, Motoki Sasakawa, Kazuhiro Tsuboi, Kazuyuki Saito, Akihiko Ito
【Journal】Progress in Earth and Planetary Science
【URL】https://progearthplanetsci.springeropen.com/articles/10.1186/s40645-023-00542-6
【DOI】10.1186/s40645-023-00542-6
8. Author of this press release
National Institute for Environmental Studies
Earth System Division
Environmental Chemodynamics Section
Head Yasunori Tohjima
Biogeochemical Cycle Modeling and Analysis Section
Head Akihiko Ito
Senior Researcher Yosuke Niwa
Office for Atmospheric and Oceanic Monitoring
Head Toshinobu Machida
Chief Senior Researcher Motoki Sasakawa
Center for Climate Change Adaptation
Director Hitoshi Mukai
Japan Agency for Marine-Earth Science and Technology
Environmental Geochemical Cycle Research Group
Deputy Group Leader Prabir K. Patra
9. Contact
Earth System Division of the National Institute for Environmental Studies
Yasunori Tohjima
- What's New
- What's New 2025
- What's New 2024
- What's New 2023
- What's New 2022
- What's New 2021
- What's New 2020
- What's New 2019
- What's New 2018
- What's New 2017
- What's New 2016
- What's New 2015
- What's New 2014
- What's New 2013
- What's New 2012
- What's New 2011
- What's New 2010
- What's New 2009
- What's New 2008
- What's New 2007
- What's New 2006
- What's New 2005
- What's New 2004
- What's New 2003
- What's New 2002
- Event Information
- Visit NIES