
Methane Concentrations and Emissions over the past three decades: Human activity in energy exploitation and livestock farming drive the growth
1. Key points
◆ Surface, aircraft and satellite measurements show that concentration of greenhouse gas methane (CH4) varied widely in the past 3 decades (1988-2016), with accelerated growth rates in the most recent decade.
◆ This study shows key CH4 emission sectors and their long-term variations using inverse analyses with atmospheric chemistry transport modeling to contribute to effective emission reduction strategies.
◆ Emissions from oil and gas exploitation and natural climate events slowed down CH4 growth rate (1988-1998) and led to the temporary pause (1999-2006).
◆ The renewed growth since 2007 is driven entirely by human activities, coal mining in China, livestock farming in South/Southeast Asia, South America, Africa regions.
2. Overview
An international research group led by Naveen Chandra of National Institute for Environmental Studies (NIES), Tsukuba, and the Japan Agency for Marine-Earth Science and Technology (JAMSTEC), Yokosuka performed the first quantitative study of CH4 growth rate in Earth’s atmosphere covering the past 3 decades. Methane is an important greenhouse gas and plays a significant role in tropospheric and stratospheric chemistry. Despite the relevance of CH4 in human-induced climate change and air pollution chemistry, there is no scientific consensus on the causes of changes in its growth rates and variability over the past three decades (Figure 1).
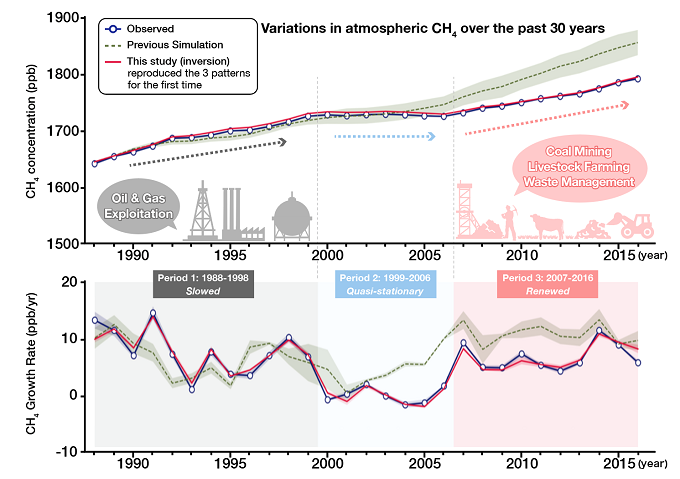
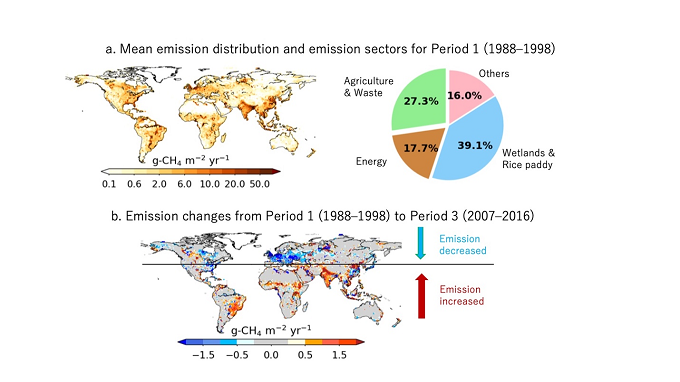
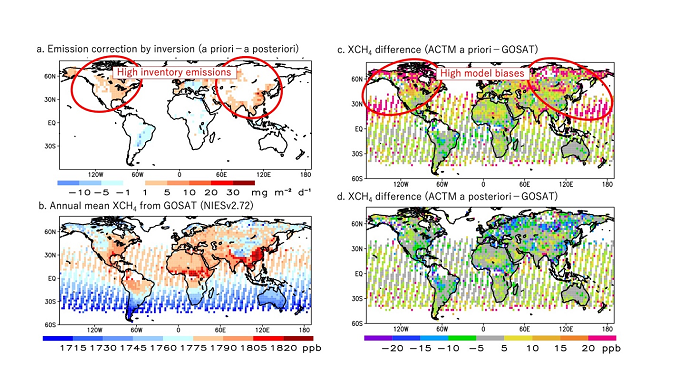
We use a well-validated chemistry-transport model for simulating CH4 concentration and estimate of regional CH4 emissions by inverse modelling for the period of 1988-2016 (※1). Our findings provide a robust set of explanations about the processes and emission sectors that led to changes in the global CH4 growth rates over the past three decades (※2), covering the three distinct periods of slowed (Period 1: 1988-1998), quasi-stationary (Period 2: 1999-2006) and renewed (Period 3: 2007-2016) phases (Figure 1). The inversion results are well validated against an independent set of extensive vertical aircraft measurements over Japan covering the three decades. We show decadal shifts in CH4 emissions toward the lower latitudes from the northern midlatitudes, relative to earlier decades (Figure 2b) and a priori estimates (Figure 3a), which can be confirmed using the global distributions of the total column CH4 (※3) observations by satellite remote sensing (Figure 3b-d).
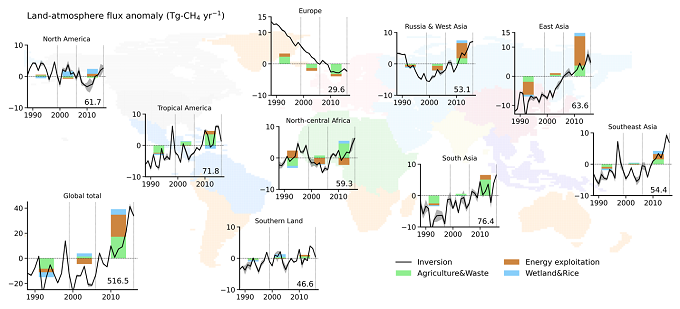
We show that reductions in emissions from Europe and Russia since 1988, particularly from oil-gas exploitation and enteric fermentation, aided by lower emissions from the natural wetland due the effects of Mount Pinatubo eruption and frequent El Niño, led to the Period 1 slowed CH4 growth rates in the 1990s (Figure 4). This period was followed by the Period 2 quasi-stationary state of CH4 growth in the atmosphere during the early 2000s. CH4 resumed growth in the Period 3 from 2007, which we attribute to increases in emissions from coal mining mainly in China and intensification of livestock (ruminant) farming and waste management in Tropical South America, North-central Africa, South and Southeast Asia. While the emission increase from coal mining in China has stalled in the post-2010 period, the emissions from oil and gas sector from North America has increased (Figure 4). As per the emission inventories, CH4 emissions from Japan decreased appreciably from 3.5 Tg/yr in the 1980s by about 35% in 2000s, but remained relatively unchanged in the post-2000 period. There is no evidence of emission enhancement due to climate warming, including the boreal regions, during our analysis period.
These findings highlight key sectors (energy, livestock and waste) for effective emission reduction strategies toward climate change mitigation. Tracking the location and source type is critically important for developing mitigation strategies and the implementation the Paris Agreement, which would require a much denser observations in space and time than the present.
Full names of funders:
This research was supported by the Environment Research and Technology Development Fund (JPMEERF20172001, JPMEERF20182002,) of the Environmental Restoration and Conservation Agency of Japan; Arctic Challenge for Sustainability Project grant (JPMXD1300000000); Arctic Challenge for Sustainability II grant (JPMXD1420318865).
Journal:
The results of this study were published online in J. Meteorol. Soc. Jpn. on December 4, 2020 (JST).
Title:
Emissions from the oil and gas sectors, coal mining and ruminant farming drive methane growth over the past three decades
Authors:
N. Chandra1,2, P.K. Patra1,6, J. S. H. Bisht1, A. Ito2, T. Umezawa2, N. Saigusa2, S. Morimoto3, S. Aoki3, G. Janssens-Maenhout4, R. Fujita5,3,*, M. Takigawa1, S. Watanabe1, N. Saitoh6, J.G. Canadell7
Affiliations:
1. Japan Agency for Marine-Earth Science and Technology (JAMSTEC), Yokohama, 236-0001, Japan
2. National Institute for Environmental Studies, Tsukuba 305-8506, Japan
3. Graduate School of Science, Tohoku University, Sendai 980-8578, Japan
4. European Commission, Joint Research Centre (JRC), Directorate for Energy, Transport and Climate, Air and Climate Unit, I-21027 Ispra (VA), Italy
5. Department of Physics, Imperial College London, London SW7 2AZ, United Kingdom
6. Center for Environ. Remote Sensing, Chiba University, Chiba, 263-8522, Japan
7. CSIRO Oceans and Atmosphere, G.P.O. Box 1700, Canberra, ACT 2601, Australia
*now at Meteorological Research Institute
DOI:
10.2151/jmsj.2021-015
Release URL:
【Supplemental information】
※1
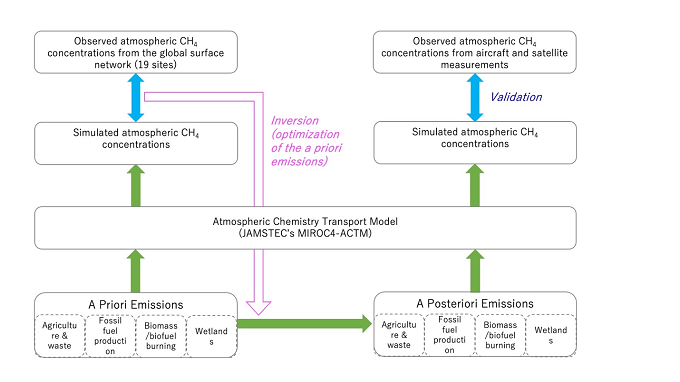
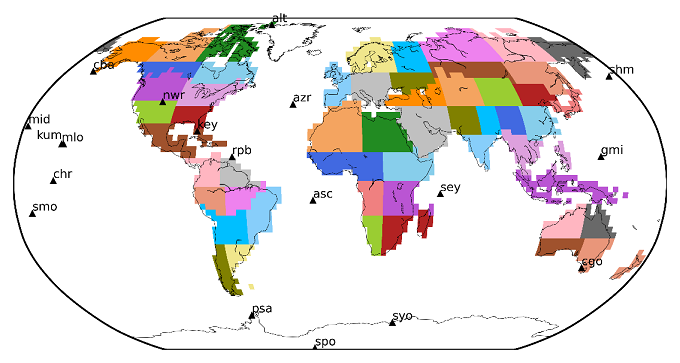
The JAMSTEC’s atmospheric chemistry transport model (ACTM) is based on the Model for Interdisciplinary Research on Climate, version 4.0 (MIROC4). The ACTM simulates CH4 concentration using prescribed meteorology, a set of surface emissions and sinks, and air chemistry for reactions. As a first step, we simulated atmospheric CH4 concentrations with the a priori emissions (Appendix Figure 1). Next the inverse model estimated a posteriori emission (optimized emissions) from 53 partitions of the global land, using the model simulated and observed CH4 differences at 19 NOAA sites (marked by black triangles) for the period of 1988-2016 (Appendix Figure 2). After that, atmospheric CH4 concentrations were simulated with the a posteriori emission for validation against aircraft and satellite measurements.
See for further details: https://www.jamstec.go.jp/e/about/press_release/20160201/
※2
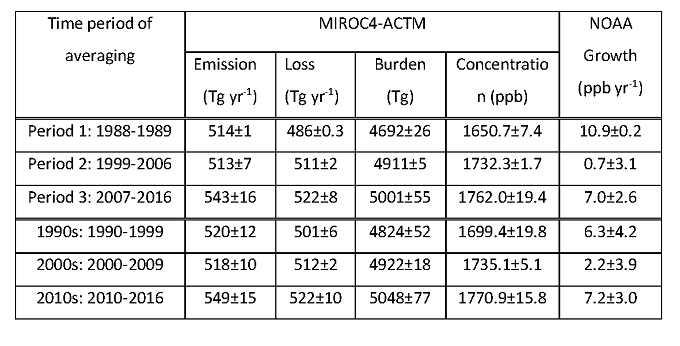
Global CH4 budget consists of decadal mean net emissions, loss by chemical reactions, atmospheric burden/concentration (1 Tg = 1012 g). The mean values for different phases of growth rates and decades are given. Ranges are 1-σ standard deviations of the annual means. Global mean CH4 growth rates are based on the NOAA report (https://www.esrl.noaa.gov/gmd/ccgg/trends_ch4/).
※3
Total column dry-air mole fractions of CH4 (XCH4) were observed by the Thermal And Near-infrared Sensor for carbon Observation (TANSO) instrument, composed of a Fourier transform spectrometer (FTS), on board the Greenhouse gases Observing Satellite (GOSAT), launched by Japan Aerospace Agency (JAXA) in 2009 (Kuze et al. 2016). We have used here the full physics retrievals of the National Institute for Environmental Studies (NIES) version 2.72 (NIESv2.72) (Yoshida et al. 2013). Vertical profiles from MIROC4-ACTM simulations are sampled at the observation location and time, and convolved with the retrieval a priori vertical profile and column averaging kernels. The individual XCH4 retrievals and model simulations are aggregated in 2.5×2.5 degrees grid-boxes for presentation here.
Contacts:
(For this study)
Naveen Chandra, Research Associate
Center for Global Environmental Research, NIES
(For press release)
Public Relations Section, NIES
(For this study)
Prabir Patra, Senior Scientist, Dy. Group Leader
Research Institute for Global Change, ESS
(For press release)
Public Relations Section, Marine Science and Technology Strategy Department, JAMSTEC
- What's New
- What's New 2025
- What's New 2024
- What's New 2023
- What's New 2022
- What's New 2021
- What's New 2020
- What's New 2019
- What's New 2018
- What's New 2017
- What's New 2016
- What's New 2015
- What's New 2014
- What's New 2013
- What's New 2012
- What's New 2011
- What's New 2010
- What's New 2009
- What's New 2008
- What's New 2007
- What's New 2006
- What's New 2005
- What's New 2004
- What's New 2003
- What's New 2002
- Event Information
- Visit NIES