Lifespan distribution type
For detail of Lifespan definition, click here.
For detail of Estimation method, click here.
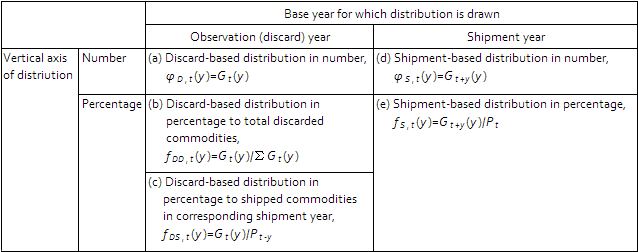
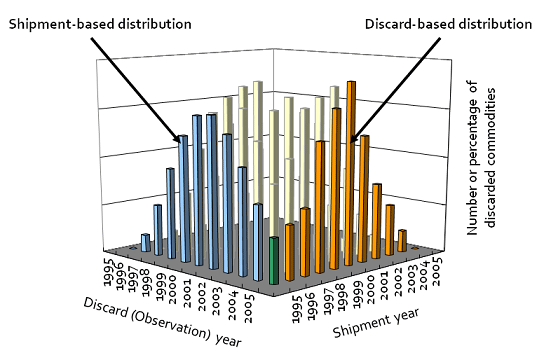
Lifespan distribution of commodities can be classified into five types from two perspectives, as shown in the table below. One perspective is the base year for which the distribution is drawn, and the other is the vertical axis of the distribution. The figure below illustrates the relationship between “discard-based distribution” and “shipment-based distribution” in three dimensions: observation year, shipment year, and number or percentage of discarded commodities.
Table. Five types of lifespan distribution of commodities

Figure. Illustration of lifespan distribution of commodities for different base years and vertical axes.

Here, PT is the number of shipped commodities in year T, GT(y) is the number of commodities discarded in year T with a lifespan of y years. For buildings and construction, the terms “shipment” and “discard” should be replaced with “construction” and “demolition,” respectively.
The features of each distribution type are as follows. For more details, see the literature listed in Research Results section of the top page.
Type a: Discard-based distribution in number
Type b: Discard-based distribution in percentage to total discarded commodities
Type a and Type b show exactly the same shape with a difference in the scale of vertical axis, because the population of distribution is the same: discarded commodities in the observation year. These two types are useful for understanding the characteristics of discarded commodities of an observation year. However, it is difficult to understand the changes in lifespan of commodities by comparing distribution between different years, because the number of discarded commodities for each lifespan is affected by the number of shipped commodities in the corresponding shipment year, that is, the shape of distribution is affected by the size of the shipments in the past.
Type c: Discard-based distribution in percentage to shipped commodities in corresponding shipment years
Type c allows comparison of lifespan distribution between different years, because Type c distribution is standardized by the size of shipments in the corresponding shipment year and would not be affected by the size of shipments in the past. Type c distribution is also useful for material flow accounting because the number of discarded commodities in a certain year can be easily estimated using the delay model.
Type d: Shipment-based distribution in number
Type e: Shipment-based distribution in percentage
Type d and Type e show exactly the same shape with a difference in the scale of vertical axis, because the population of distribution is the same: shipped commodities in the shipment year. Shipment-based distributions reflect lifespan distribution for a certain shipment cohort; therefore, these types are useful in the case where the lifespan distribution of commodities would be determined by shipment year, for example, commodities which would be discarded mainly for mechanical failure. When estimating the number of discarded commodities in a certain year using these types of distribution, it is needed to know the distribution for the past dozen shipment years.