


Information of Paper
Author:Yamaguchi, R., Islam, M., & Managi, S.
Year:2019
Journal:Letters in Spatial and Resource Sciences, forthcoming
Link to the paper
Keywords
Sustainable development, Inclusive wealth, Natural capital, Produced capital, Human capital
Abstract
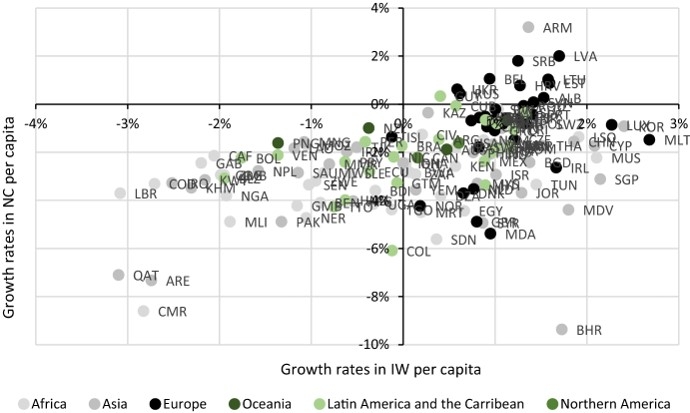
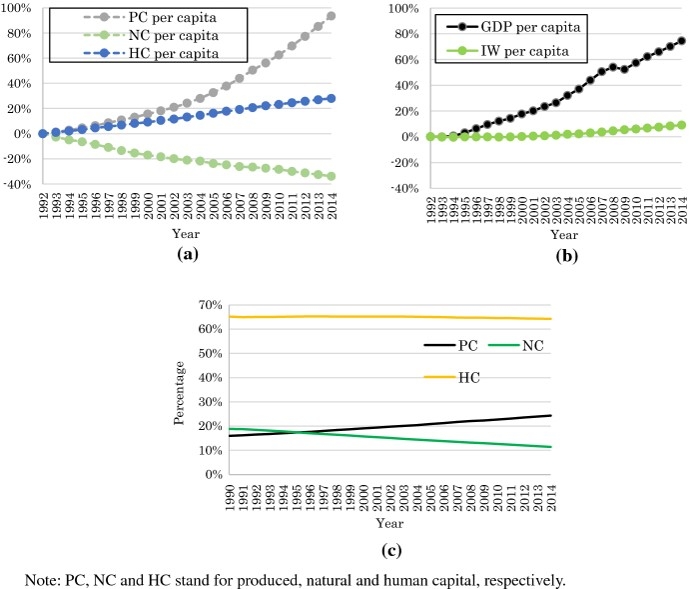
It is increasingly common to judge the sustainable development of nations by non-declining social well-being. Determinants of social well-being have been measured and used for sustainability analysis. In particular, inclusive wealth per capita, which comprises produced, human, and natural capital, was reported in the Inclusive Wealth Report in 2012 and 2014. Here, we report the updates of the third edition of the report, which covers 140 countries from 1990 to 2014. In per capita terms, only 60% out of 140 countries show non-declining wealth for the past quarter century. Most countries, both developed and developing, fall into the group of running down natural capital and increasing produced and, to a lesser extent, human capital. We also include fishery stock as part of natural capital, and we find that only a few countries have increased their fishery capital in the studied period. Inclusive wealth has typically grown much less than GDP per capita and does not resemble change in other development indices. Globally aggregated produced and human capital per capita increased 94% and 28%, respectively, while natural capital per capita declined by 34%. In 2014, produced, human, and natural capital account for 24%, 64%, and 11%, respectively, which is similar to the recent findings by the World Bank. In addition, inclusive wealth is approximately 12 times GDP on average, much higher than conventional wealth-income ratios globally, and is at least at par with those ratios in high-income countries under financialization.