
World Mangrove Distribution Maps
Global distribution of mangroves has changed throughout geological history and has also been affected through human influence. Although there are no accurate data on the original coverage of mangroves, the current areas represent a considerable decline, especially during the past 50 years, as a result of human activities involving development and conversion in almost all the countries where they are found. According to the World Atlas of Mangroves (2010), the area covered by mangroves globally is 152,360 km2 in over 123 countries and territories of the tropics and subtropics. This represents less than 1% of global tropical forests and less than 0.4% of the total forest area worldwide. Over 65% of the world’s mangroves are distributed in twelve countries, and Indonesia accounts for over 20% of the total global area.
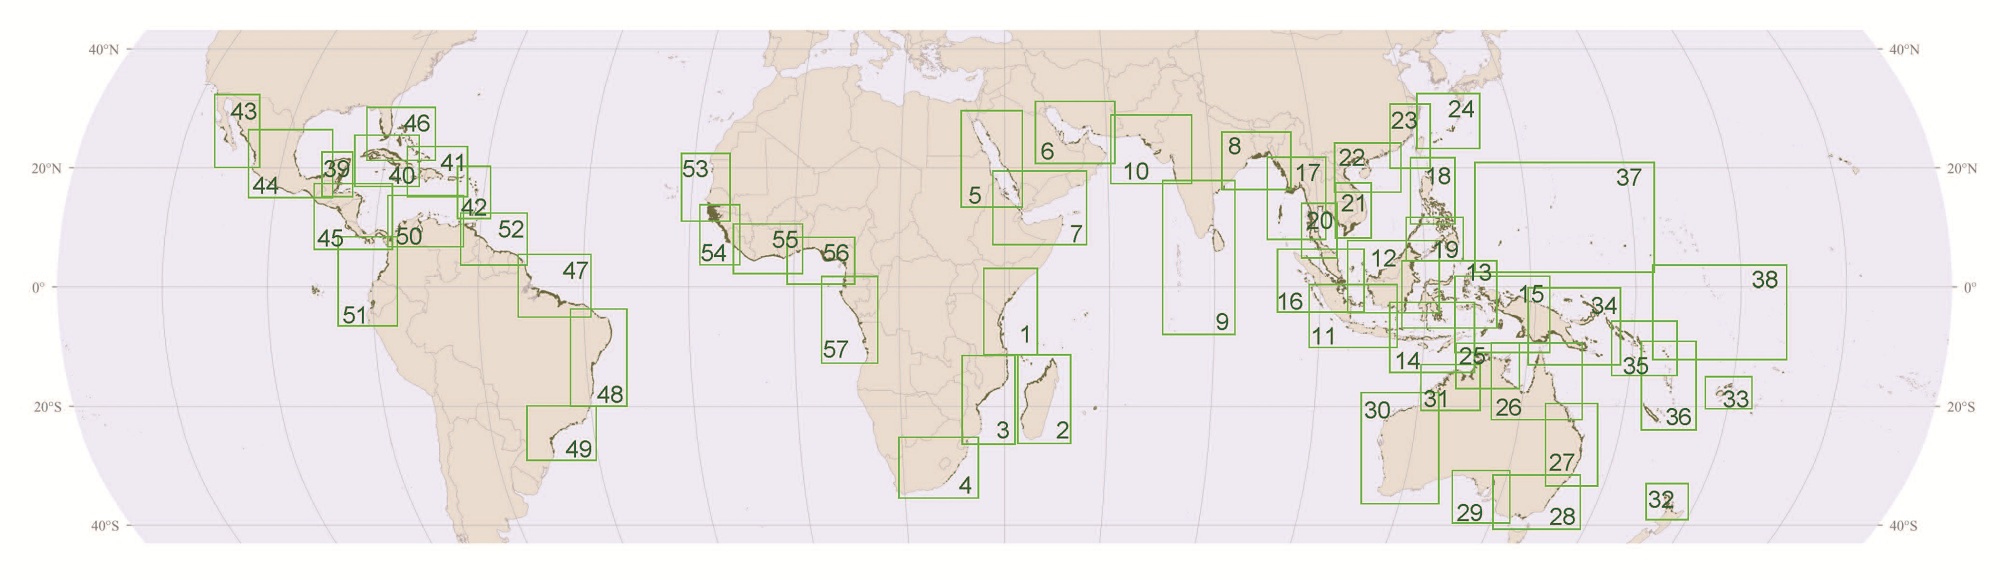
The following global mangrove distribution map and 62 regional/country-by-country maps were prepared for the Atlas (2010). Some maps have been revised and updated by NIES/ISME (i.e. Vietnam). The production of the original GIS dataset was coordinated by ISME and led by FAO, UNEP-WCMC and TNC, mainly by analyzing Landsat imagery covering over 50% of the mangrove areas, which was taken during the period 2000-2003. The data for the remaining coverage of mangroves was generously contributed by various national and international organizations and mangrove experts, and were typically at a resolution of 1:250,000 or better, with consistent age. It is our hope that this will serve as a baseline for future gain/loss assessment.
The global map also shows the latitudinal limits to mangrove distribution. The most northerly mangroves are in Bermuda (32° 20’N) and the most southerly are at Corner Inlet, Australia (38°45’S). The largest mangrove tracts are found on wet deltaic coasts, which extend inland for several tens of kilometers, with large forest trees over 20 m in height and which are high in biomass. The Sundarbans of India and Bangladesh are the best known forests with a total area of 6,500 km2 which extend up to 85 km inland. Large mangrove tracts are also found in Northern Brazil (6,500 km2) and the Gulf of Papua (5,400 km2).
We will be updating the maps periodically to add newer information.
Reference:
Spalding, M., M Kainuma and L. Collins (2010) World Atlas of Mangroves. A collaborative project of ITTO, ISME, FAO, UNEP-WCMC, UNESCO-MAB, UNU-INWEH and TNC. Earthscan UK and USA. 319pp.
Western Indo-Pacific 

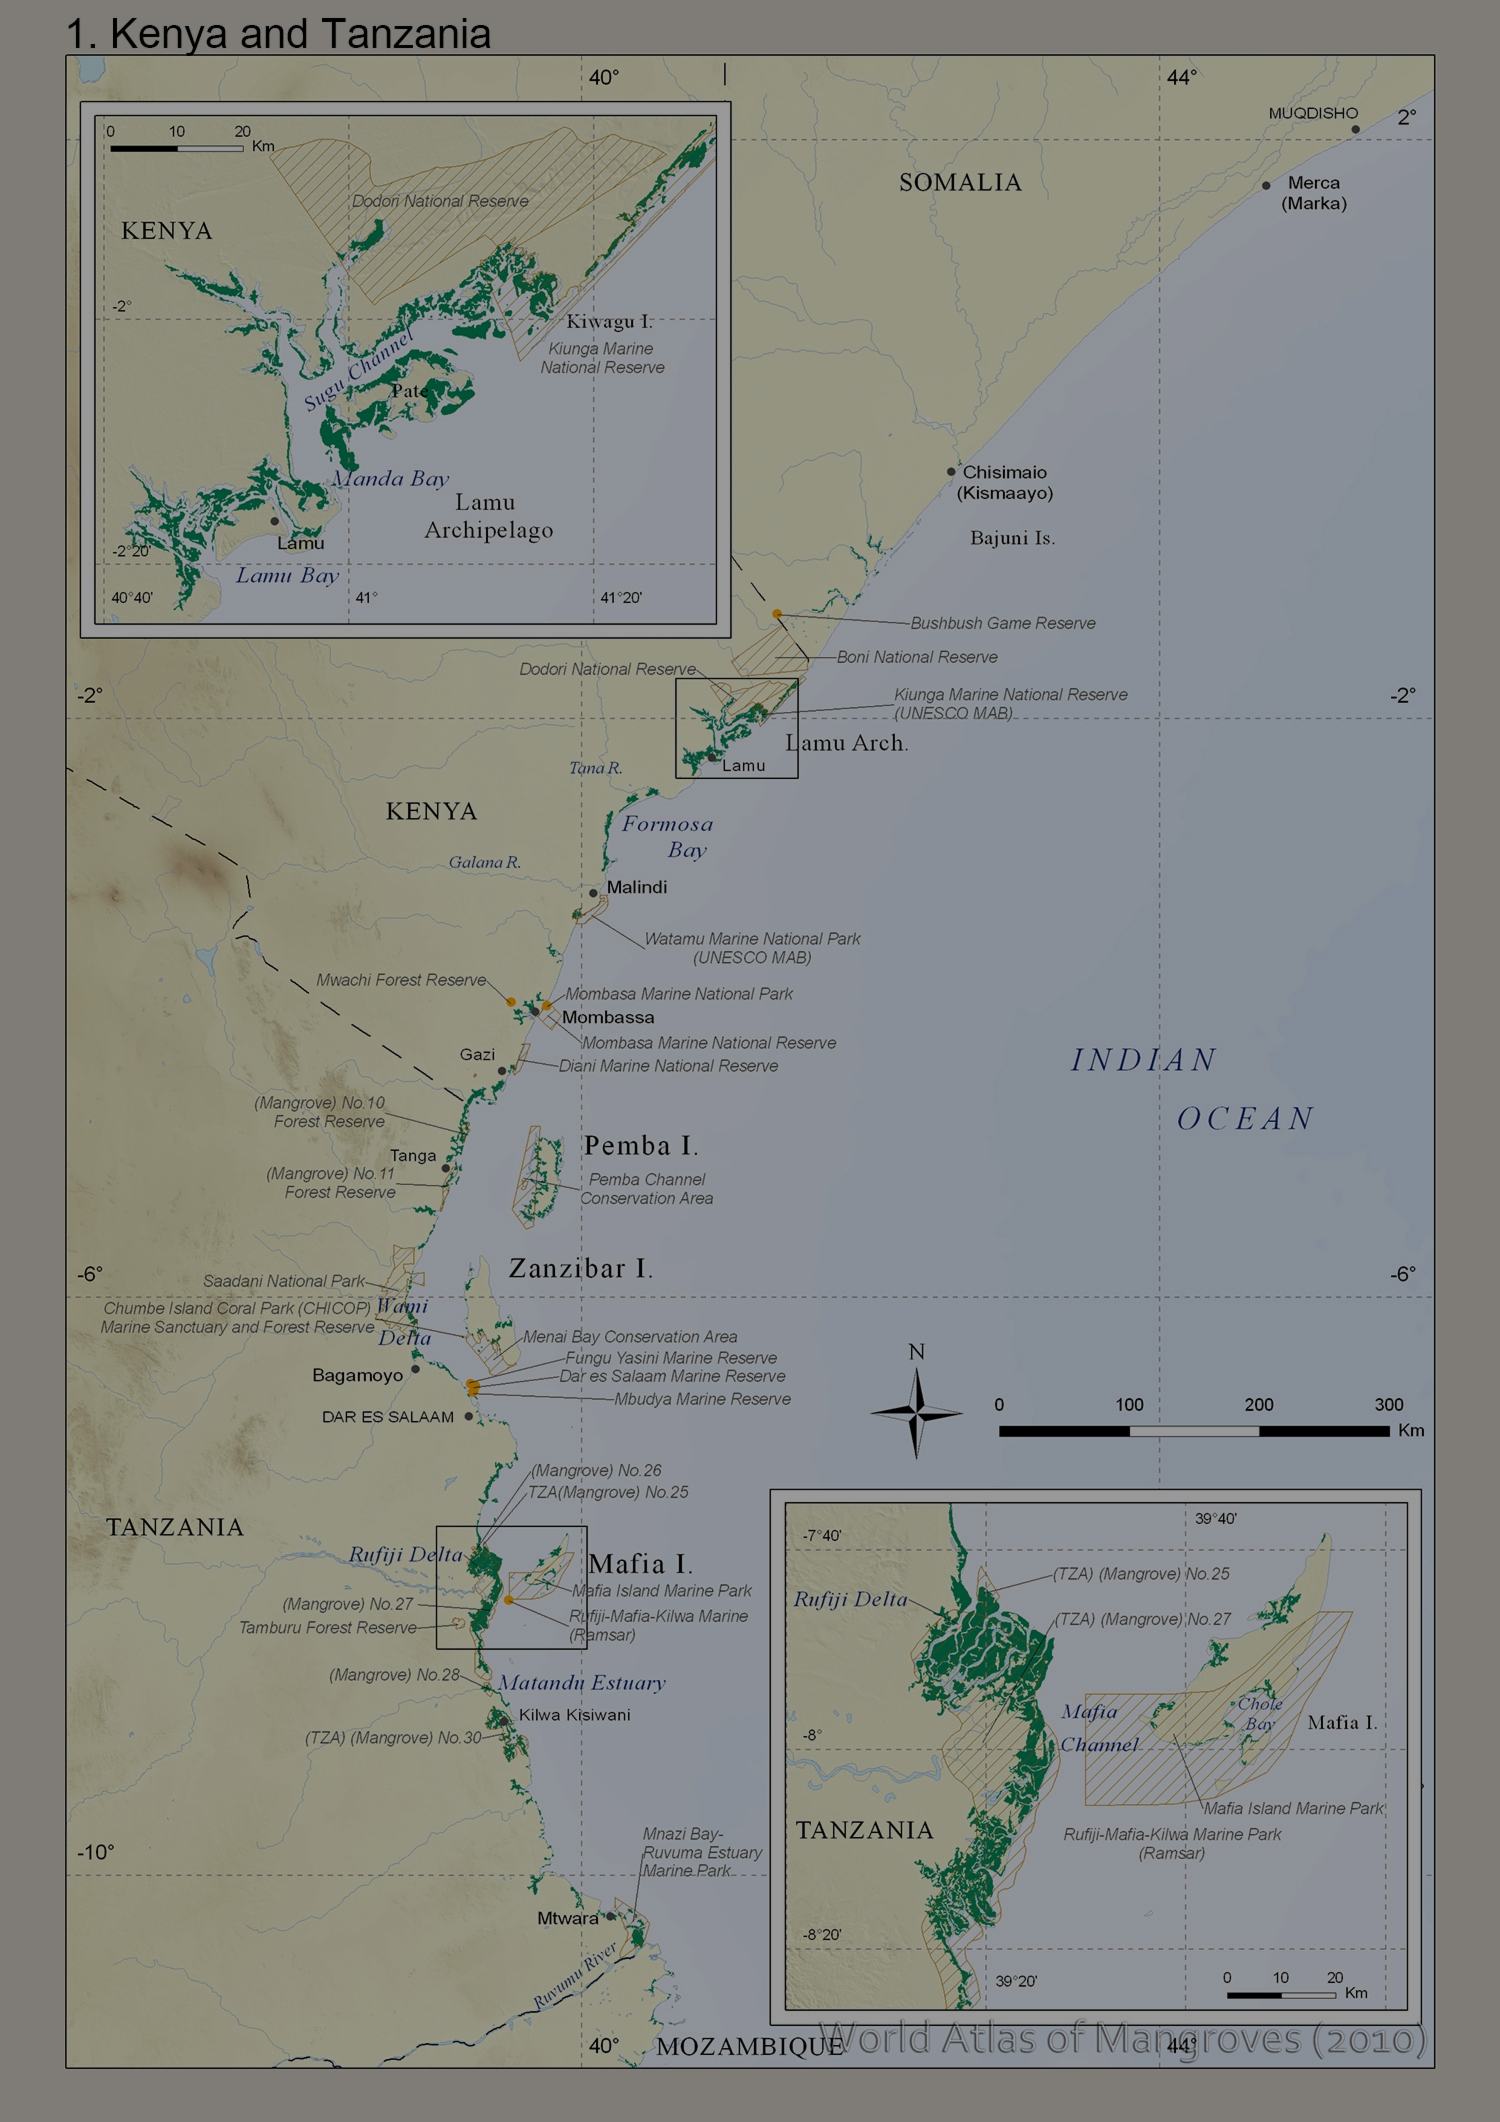
1. Kenya and Tanzania 
2. Madagascar 

3. Mozambique 

4. South Africa 

5. Red Sea 

6. Arabian Gulf and Gulf of Oman 

7. Gulf of Aden 

8. Northern Bay of Bengal 

9. Southern India, Sri Lanka and the Maldives 

10. Pakistan and north-west India 

Central Indo-Pacific 

11. South Sumatra and Java 

12. Borneo 

13. Sulawesi 

14. Nusa Tenggara 

15. Papua (Indonesia) 

16. Peninsula Malaysia and Sumatra 

17. Myanmar 

18. Northern Philippines 

19. Southern Philippines 

20. Thailand 

21. Cambodia and southern Vietnam 

22. Northern Vietnam and South China 

23. Eastern China and Taiwan 

24. Japan 

25. Northern Australia 

26. North-eastern Australia 

27. Eastern Australia 

28. South-eastern Australia 

29. South Australia 

30. Western Australia 

31. North-western Australia 

32. New Zealand 

![]()
Eastern Indo-Pacific 

33. Fiji 

34. Papua New Guinea 

35. Solomon Islands 

36. Vanuatu and New Caledonia 

37. Western Micronesia 

38. Kiribati and Tuvalu 

The Americas 

39. Yucatan, Belize and northern Honduras 

40. Cuba and Jamaica 

41. Eastern Greater Antilles 

42. Lesser Antilles 

43. Gulf of California 

44. Gulf of Mexico 

45. Central America 

46. Florida and the Bahamas 

47. Northern Brazil 

48. North-eastern Brazil 

49. Southern Brazil 

50. Northern Colombia and western Venezuela 

51. Pacific South America 

52. Eastern Venezuela and the Guianas 

West and Central Africa 

53. North-west Africa 

54. Guinea Bissau to Sierra Leone 

55. Liberia, Cote d'Ivorie and Ghana 

56. Gulf of Guinea 

57. Gabon to Angola 

Click the icon to view each map. Maps can be zoomed with "Ctrl + mouse cursor".
* Please note that the purpose of the mangrove distribution maps is to show the distribution of mangroves in each country and does not reflect the actual area. For the purpose of visibility, mangroves are generally drawn with a bounding line of 0.2 point (0.07 mm), this was increased to 0.4 points in a few mangrove restricted places such as the Red Sea, Gulf of Aden, eastern China and Taiwan. For Japan, it was increased to 0.7 points for better visibility. The maps also contain information on protected areas relevant to mangroves.
last updated on Oct. 13th, 2015
![]()