Private-public partnership helps to evaluate satellite observations of atmospheric CO2 over oceans
Observations of carbon dioxide (CO2) on board cargo ship and passenger aircraft are upscaled for an expansion of the column-averaged CO2 (XCO2) database uniquely over the ocean. This XCO2 data will be used for improving satellite retrieval algorithms over the water bodies.
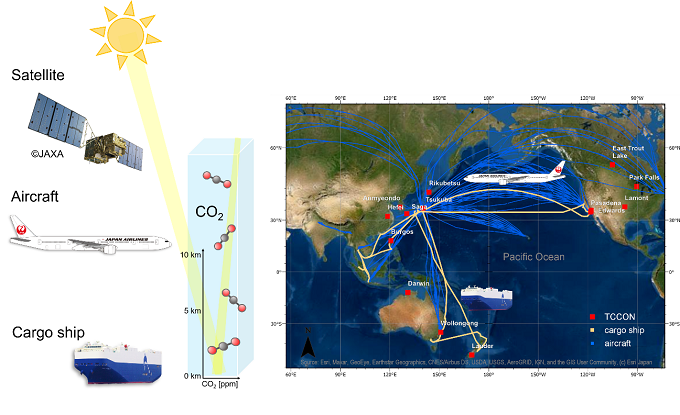
Hiroshi Tanimoto, Director of the Earth System Division at the National Institute for Environmental Studies (NIES), Japan, and Astrid Müller together with their international research team, have developed a new method to evaluate satellite observations of XCO2 over open ocean areas, which are currently inaccessible through established validation network sites. In the new approach, a reference CO2 dataset is formulated by combining cargo ship and passenger aircraft observations which were conducted in cooperation with operators of the private sector.
(Background)
After the Paris Agreement entered into force, commitment to reduce greenhouse gas emissions are being expedited. CO2 is the most important anthropogenically produced greenhouse gas. Emissions due to fossil fuel combustion and cement production have caused an accelerated increase of atmospheric CO2 to more than 410 ppm in 2020 since the 1950s (Dlugokencky and Tans, 2021). High quality and high density measurements are needed to estimate changes in anthropogenic and natural emission towards the implementation of the Paris Agreement and achieving the goal of net-zero greenhouse gas emission. Increased research and development activities have been led to monitor CO2 from more than 200 locations on the earth’s surface (in 1958, it has been only 2 sites), and by a growing fleet of space-based satellites with global coverage. Among these satellites, the Greenhouse Gases Observing Satellite (GOSAT) and the Orbiting Carbon Observatory 2 (OCO-2) have been launched in 2009 and 2014. The advantage of the space-based observations is their high spatial and temporal coverage, even over inaccessible areas of the globe, albeit at a lower accuracy compared to the in situ measurements. Ocean surfaces are among these difficult to access areas. They cover 70% of the Earth and play the most reliable role in the removal (~2.5 PgC/yr) of the anthropogenic emitted CO2 (~10 PgC/yr) into the atmosphere (Friedlingstein et al., 2019).
Satellite XCO2 data products require validation, which is usually performed against land-based XCO2 data products from the Total Carbon Column Observing Network (TCCON) (Wunch et al., 2011), a network of ground-based Fourier transform infrared spectrometers. However, validation sites observing the atmosphere over the ocean are limited to some coastal and island sites. Therefore, the accuracy of the satellite XCO2 data products over the ocean cannot be fully verified by using TCCON.
Recent studies pointed out that there is apparently a greater bias in the satellite observations over oceans than over land surfaces. TCCON observations of XCO2 at Burgos in the Philippines indicated a bias of satellite XCO2 of –0.8 ppm in the vicinity of the tropical Pacific (Velazco et al., 2017). A bias of –0.7 ppm was also seen by observations of vertical CO2 profiles using aircraft (Kulawik et al., 2019). However, these aircraft campaigns are limited and expensive. To improve satellite data over oceans, there has been no effective method to systematically evaluate ocean biases over long temporal periods and wide spatial areas until now.
In cooperation with the private sector, the National Institute for Environmental Studies has conducted long-term atmospheric observations by cargo ships operating between Japan and North America, Australia, and Southeast Asia, and passenger aircrafts flying from Japan to various parts of the world. Taking advantage of the regular and cost-efficient observations with wide geographical coverage, the new approach is an effective method to evaluate satellite observations over the oceans where no reference data were available. In this study, we applied the method to CO2 in the western Pacific Ocean.
(Method)
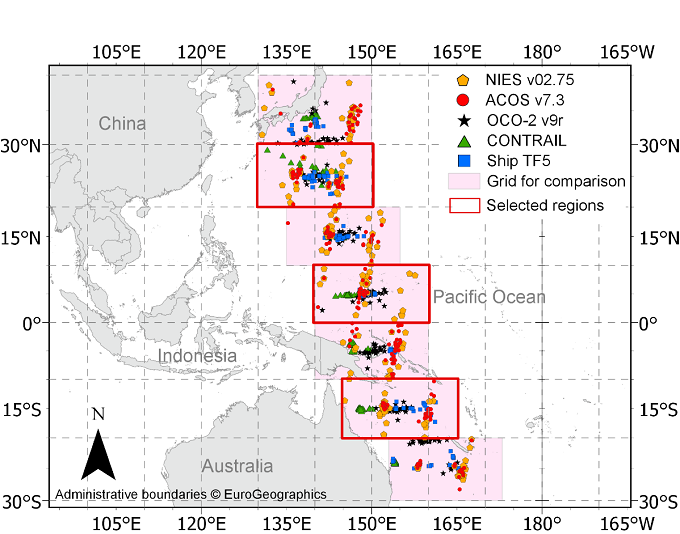
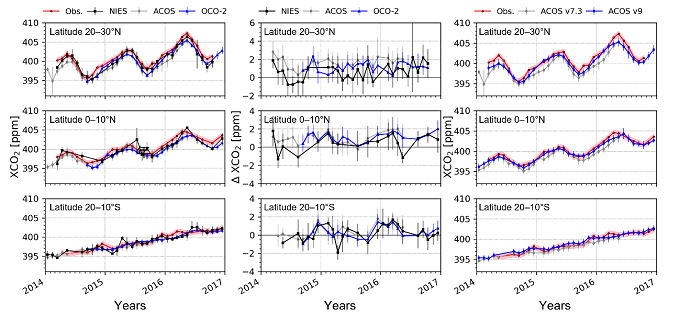
In our study, we combine cargo ship (Ship Of Opportunity - SOOP) and passenger aircraft (Comprehensive Observation Network for Trace gases by Airliner - CONTRAIL) observations of CO2, and, with the aid of model calculations, we constructed CO2 profiles from which we obtained the “observation-based column-averaged mixing ratios of CO2“ (obs. XCO2) data over the Pacific Ocean. We analyzed the consistency of the obs. XCO2 dataset with satellite estimates from GOSAT (Greenhouse gases observing satellite: NIES v02.75, National Institute for Environmental Studies; ACOS v7.3, Atmospheric CO2 Observation from Space) and OCO-2 (Orbiting Carbon Observatory, v9r).
(Results)
Our analysis revealed that the new dataset accurately captures seasonal and interannual variations of CO2 over the western Pacific Ocean. In the comparison of satellite XCO2 from GOSAT and OCO-2 with the obs. XCO2 dataset, we found a negative bias of about 1 ppm in northern midlatitudes. This bias was substantially reduced for newer satellite products (ACOS v9, OCO-2 v10). The differences between the obs. XCO2 and satellite XCO2 could be attributed to remaining uncertainties in the satellite data, introduced by limitations in the retrieval algorithms due to the lack of validation data over open oceans. With our new approach, these uncertainties can be identified.
(Expectations for the future)
Advances in retrieval algorithms are made rapidly, with almost one new version each year. To evaluate the improvements in these algorithms, our new approach is of great importance. With the help of the private sector, we can rapidly extent the spatial and temporal coverage of reference data as complement to established validation networks. We expect that we can contribute with the new dataset to the further improvements of the satellite data and therefore, contribute to a better understanding of changes in the carbon cycle in response to climate change. In future, our new method of combining cargo ship and passenger aircraft observations will be spatially and temporally extended and applied to other important trace gases. In specific, we plan to use the new dataset for the evaluation GOSAT GW, which is scheduled to be launched in 2023.
(References)
Dlugokencky, E. and Tans, P.: Trends in Atmospheric Carbon Dioxide, NOAA/GML, available at: http://www.esrl.noaa.gov/gmd/ccgg/trends/, last access: 7 January 2021.
Friedlingstein, P., Jones, M. W., O’Sullivan, M., Andrew, R. M., Hauck, J., Peters, G. P., Peters, W., Pongratz, J., Sitch, S., Le Quéré, C., Bakker, D. C. E., Canadell, J. G., Ciais, P., Jackson, R. B., Anthoni, P., Barbero, L., Bastos, A., Bastrikov, V., Becker, M., Bopp, L., Buitenhuis, E., Chandra, N., Chevallier, F., Chini, L. P., Currie, K. I., Feely, R. A., Gehlen, M., Gilfillan, D., Gkritzalis, T., Goll, D. S., Gruber, N., Gutekunst, S., Harris, I., Haverd, V., Houghton, R. A., Hurtt, G., Ilyina, T., Jain, A. K., Joetzjer, E., Kaplan, J. O., Kato, E., Klein Goldewijk, K., Korsbakken, J. I., Landschützer, P., Lauvset, S. K., Lefèvre, N., Lenton, A., Lienert, S., Lombardozzi, D., Marland, G., McGuire, P. C., Melton, J. R., Metzl, N., Munro, D. R., Nabel, J. E. M. S., Nakaoka, S.-I., Neill, C., Omar, A. M., Ono, T., Peregon, A., Pierrot, D., Poulter, B., Rehder, G., Resplandy, L., Robertson, E., Rödenbeck, C., Séférian, R., Schwinger, J., Smith, N., Tans, P. P., Tian, H., Tilbrook, B., Tubiello, F. N., van der Werf, G. R., Wiltshire, A. J., and Zaehle, S.: Global Carbon Budget 2019, Earth Syst. Sci. Data, 11, 1783–1838, https://doi.org/10.5194/essd-11-1783-2019, 2019.
Kulawik, S. S., Crowell, S., Baker, D., Liu, J., McKain, K., Sweeney, C., Biraud, S. C., Wofsy, S., O’Dell, C. W., Wennberg, P. O., Wunch, D., Roehl, C. M., Deutscher, N. M., Kiel, M., Griffith, D. W. T., Velazco, V. A., Notholt, J., Warneke, T., Petri, C., De Mazière, M., Sha, M. K., Sussmann, R., Rettinger, M., Pollard, D. F., Morino, I., Uchino, O., Hase, F., Feist, D. G., Roche, S., Strong, K., Kivi, R., Iraci, L., Shiomi, K., Dubey, M. K., Sepulveda, E., Rodriguez, O. E. G., Té, Y., Jeseck, P., Heikkinen, P., Dlugokencky, E. J., Gunson, M. R., Eldering, A., Crisp, D., Fisher, B., and Osterman, G. B.: Characterization of OCO-2 and ACOS-GOSAT biases and errors for CO2 flux estimates, Atmos. Meas. Tech. Discuss. [preprint], https://doi.org/10.5194/amt-2019-257, 2019.
Velazco, V. A., Morino, I., Uchino, O., Hori, A., Kiel, M., Bukosa, B., Deutscher, N. M., Sakai, T., Nagai, T., Bagtasa, G., Izumi, T., Yoshida, Y., and Griffith, D. W. T.: TCCON Philippines: First measurement results, satellite data and model comparisons in Southeast Asia, Remote Sens., 9, 1–18, https://doi.org/10.3390/rs9121228, 2017.
Wunch, D., Toon, G. C., Blavier, J.-F. L., Washenfelder, R. A., Notholt, J., Connor, B. J., Griffith, D. W. T., Sherlock, V., and Wennberg, P. O.: The Total Carbon Column Observing Network, Philos. T. R. Soc. A, 369, 2087–2112, https://doi.org/10.1098/rsta.2010.0240, 2011.
Contacts
Contact Person:Hiroshi Tanimoto, Astrid Müller
Journal:
Atmospheric Chemistry and Physics
DOI
10.5194/acp-21-8255-2021
Full names of funders:
The Global Environmental Research Coordination System from the Ministry of the Environment, Japan (E1851, E1253, E1652, E1151, E1951, E1451, E1751, E1432), and the Environmental Research and Technology Development Fund (ERTDF) from the Ministry of the Environment, Japan (grant no. 2-1803. JPMEERF20182003).
- What's New
- What's New 2025
- What's New 2024
- What's New 2023
- What's New 2022
- What's New 2021
- What's New 2020
- What's New 2019
- What's New 2018
- What's New 2017
- What's New 2016
- What's New 2015
- What's New 2014
- What's New 2013
- What's New 2012
- What's New 2011
- What's New 2010
- What's New 2009
- What's New 2008
- What's New 2007
- What's New 2006
- What's New 2005
- What's New 2004
- What's New 2003
- What's New 2002
- Event Information
- Visit NIES