Analysis result of the proxy-method based retrievals from GOSAT-2 data :
methane and carbon monoxide
(Distributed simultaneously to Tsukuba Science City Press Club, Environment Press Club, and Ministry of the Environment Press Club)
Friday, July 5, 2019
Satellite Observation Center
Center for Global Environmental Research
National Institute for Environmental Studies, Japan
Tsuneo Matsunaga Director
Yukio Yoshida Senior Researcher
Isamu Morino Senior Researcher
Makoto Saito Senior Researcher
Yosuke Niwa Senior Researcher
Hirofumi Ohyama Senior Researcher
Akihide Kamei Specialist
Tazu Saeki Specialist
We will further work on estimating column-averaged dry-air mole fraction of carbon dioxide using the full-physics method while proceeding validation of the acquired concentration data by comparing to ground-based observational data as well as to data acquired by similar satellites from Europe and the U.S.
Greenhouse gasses Observation SATellite-2 “IBUKI-2” (GOSAT-2) was jointly developed by the Ministry of the Environment of Japan (MOE), the Japan Aerospace Exploration Agency (JAXA) and the National Institute for Environmental Studies (NIES) (hereinafter, collectively, the “Three Parties”) as the successor to Greenhouse gasses Observation SATellite “IBUKI” (GOSAT) which was developed by the same Three Parties and has been in operation since its launch in 2009.
GOSAT-2 was launched on October 29, 2018 from the JAXA Tanegashima Space Center with the H-IIA Launch Vehicle No. 40 (H-IIA F40). Later, GOSAT-2 collected the first light data from the onboard instruments; first on November 5-6, 2018, images from the Thermal And Near infrared Sensor for carbon Observation - Cloud and Aerosol Imager-2 (CAI-2), and on December 12-14, 2018, data from the Thermal And Near infrared Sensor for carbon Observation - Fourier Transform Spectrometer-2 (FTS-2) were acquired, confirming that the onboard instruments were operating normally. Further, on February 1, 2019, GOSAT-2 shifted its operation mode to nominal and started global observations by CAI-2 and FTS-2. In this press release, we will summarize the analysis result of the proxy-method based retrievals from the data acquired by FTS-2. The proxy method used this time can apply to methane (CH4) and carbon monoxide (CO) retrievals but is not applicable to carbon dioxide (CO2) retrieval. This method is however, characterized in that even in the substantial influence of clouds and aerosols that requires filtering of data to be processed and quality control of retrieval results, column-averaged dry-air mole fraction can be retrieved in relatively high precision.
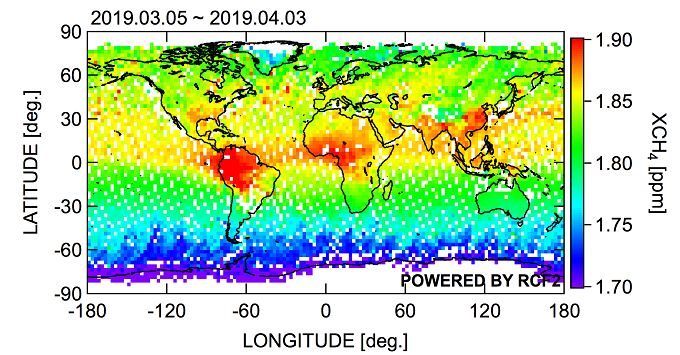
Figure 1 is the global distribution of methane column-averaged dry-air mole fraction (XCH4) retrieved from data acquired by FTS-2 from March 5 to April 3, 2019. This time, the proxy method was applied to FTS-2 Level 1B product (V002.004) to retrieve XCH4. The figure depicts the higher CH4 concentration in Southeast and South Asia, Central Africa and in the northern part of South America, in which many wetlands and forest fires, large sources of methane emissions, have been seen.
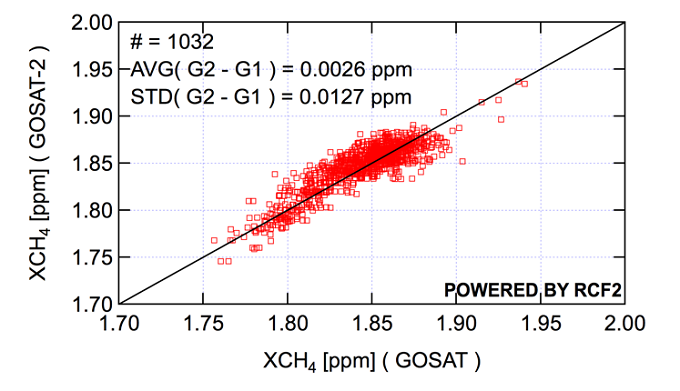
Figure 2 is the comparison of GOSAT-2 XCH4 (Proxy Method) with GOSAT XCH4 (Full Physics Method) for the same period. The mean difference in XCH4 between GOSAT and GOSAT-2 is found to be 0.0026 ppm (2.6 ppb) and the standard deviation (SD) is 0.0127 ppm (12.7 ppb). The precision of GOSAT XCH4 has already been verified by comparing with ground-based data, where the mean difference is 0.0019ppm (1.9 ppb) and the SD is 0.0134 ppm (13.4 ppb). Given that these values are almost the same compared to GOSAT-2 XCH4, GOSAT-2 XCH4 retrievals are considered reasonable.
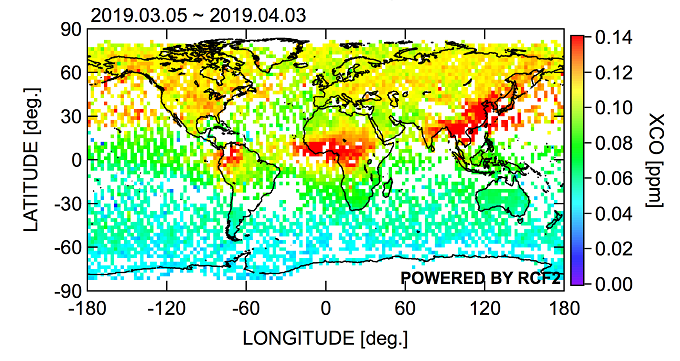
Likewise, Figure 3 is the global distribution of carbon monoxide column-averaged dry-air mole fraction (XCO) retrieved by the proxy method from FTS-2 data, showing that XCO concentration is higher in South Asia and Central Africa where CO emissions from sources including fossil fuel use and forest fire are high. The similar distribution has also been seen in data derived for the same period by the TROPOspheric Monitoring Instrument (TROPOMI) on board Sentinel-5p, one of the European earth observation satellites. In addition, the estimated concentration values are confirmed to be mostly consistent with ground-based data acquired at several observation sites in the world. On another note, CO is one of the GOSAT-2’s newly adopted measuring items, which is expected to be used to identify greenhouse gas emission sources. It should also be noted that CAI-2 data including cloud discrimination products are not yet utilized at this time, and FTS-2 data which were acquired in the presence of clouds may be included in the retrieval results presented here.
We will further work on estimating column-averaged dry-air mole fraction of CO2 using the full-physics method while proceeding validation of acquired concentration data by comparing with ground-based observational data as well as data acquired by similar satellites from Europe and the U.S. GOSAT-2 Level 2 products including the concentration data mentioned above are scheduled to be publicly released in one year from the launch of GOSAT-2, that is after the end of October, 2019.
[Researchers at NIES]
[Acknowledgement]
(2): https://jra.kishou.go.jp/JRA-55/index_en.html
(3): http://www.cger.nies.go.jp/en/activities/supporting/supercomputer/
http://www.gosat-2.nies.go.jp/about/rcf2/
| • Orleans: | University of Bremen (Germany) |
| • Rikubetsu and Tsukuba: | NIES (Japan) |
| • Saga: | JAXA (Japan) |
| • Burgos: | Installed by GOSAT Series Project and operated jointly by NIES, University of Wollongong (Australia), and Energy Development Corporation (EDC, the Philippines) |
| • Wollongong: | University of Wollongong |
| • Lauder: | National Institute of Water and Atmospheric Research (New Zealand) |
[Contact]
Tsuneo Matsunaga
Director, Satellite Observation Center, National Institute for Environmental Studies
Phone: +81-29-850-2838,
E-mail: matsunag (please append ‘@nies.go.jp’ to complete the e-mail address)
GOSAT-2 Project, National Institute for Environmental Studies
Phone: +81-29-850-2731/2966,
E-mail: gosat-2-info (please append ‘@nies.go.jp’ to complete the e-mail address)
[Glossary]
Observation data by earth observing satellites are generally distributed by four major data products: Level 1 data products (equivalent to raw data), Level 2 data products (data converted into physical values), Level 3 data products (temporal and spatial averaged Level 2 data products), and Level 4 data products (processed data by inputting Level 1- 3 data products into models). GOSAT-2 Level 2 data products are the column-averaged dry-air mole fraction of CO2, CH4, and CO.
The proxy method is one of methods to reduce the effects of the variation of the optical path length caused by scattering by clouds and aerosols in the estimation of the column-averaged dry-air mole fraction. It uses a ratio of the column-averaged dry-air mole fraction of two gases whose absorption bands are adjacent to each other, which are estimated under the assumption of no clouds or aerosols. It can obtain relatively accurate column-averaged dry-air mole fraction even if clouds and aerosols somewhat affect the optical path length, whereas it has disadvantages that its target gases of retrieval are limited, and CO2 is not applicable.
(Reference: Yoshida, Y. (2019) Journal of Remote Sensing Society of Japan, 39, 1, 22-28)
The full physics method is to estimate the column-averaged dry-air mole fraction by directly calculating the effects of the variation of the optical path length using a forward model, with parameters which describes the status of clouds and aerosols. The full physics method has no limitation of its target gases of retrieval, whereas it is more easily affected by the variation of the optical path length caused by clouds and aerosols. Measures are necessary, such as the selection of data to be processed and the quality control of retrieved results.
(Reference: Yoshida, Y. (2019) Journal of Remote Sensing Society of Japan, 39, 1, 22-28)
A numerical value of the total amount of gas represented by number of gas molecules in the column from the surface to the top of the atmosphere per unit area.
A ratio of the column amount of a greenhouse gas to the column amount of dry air.
(Reference: https://www.nies.go.jp/kanko/kankyogi/69/column2.html (in Japanese))
The forward model described in this press release is a model to estimate the upward radiance spectrum at the top of the atmosphere, including sunlight reflected from the surface, observed by the satellite after the assumptions of gaseous concentration, cloud and aerosol distribution, and surface reflectance.
The optical path length described in this press release is the product of the average length of sunlight propagating through atmosphere to the satellite multiplied by the refractive index of the atmosphere. Sunlight reaches the satellite through various routes while scattered by gaseous molecules, clouds and aerosols, and reflected from the surface. The routes vary depending on the amounts or distribution of clouds and aerosols and the surface reflectance. The optical path length also varies according to the route.
A kind of unit of atmospheric gas concentration. 1 ppm represents one-millionth.
A kind of unit of atmospheric gas concentration. 1 ppb represents one-billionth.
[Related websites]
-
http://www.gosat-2.nies.go.jp/
-
http://www.nies.go.jp/soc/
-
http://www.gosat.nies.go.jp/en/
-
https://data2.gosat.nies.go.jp/index_en.html
- What's New
- What's New 2025
- What's New 2024
- What's New 2023
- What's New 2022
- What's New 2021
- What's New 2020
- What's New 2019
- What's New 2018
- What's New 2017
- What's New 2016
- What's New 2015
- What's New 2014
- What's New 2013
- What's New 2012
- What's New 2011
- What's New 2010
- What's New 2009
- What's New 2008
- What's New 2007
- What's New 2006
- What's New 2005
- What's New 2004
- What's New 2003
- What's New 2002
- Event Information
- Visit NIES