"IBUKI" (GOSAT) Satellite's Historically Unprecedented Observation of Anthropogenic CO2 Emissions of Mega-City Regions from Space
National Institute for Environmental Studies
Ministry of the Environment, Japan
Japan Aerospace Exploration Agency
1. Overview of the data on anthropogenic CO2 concentrations from “IBUKI” (GOSAT)
Carbon dioxide (CO2) is a greenhouse gas the atmospheric concentration of which has increased by 40% when compared to pre-industrial times, as a result of anthropogenic activities. Fossil fuel consumption in large fossil fuel power plants and mega-cities are assumed to be the main sources of anthropogenic CO2 emissions. The CO2 emission rates in these areas should be accurately evaluated to monitor greenhouse gas emissions.
A validation study has shown that the greenhouse gases observation sensor, “TANSO-FTS” onboard “IBUKI” observes column-averaged CO2 concentrations (hereinafter, “CO2 concentrations”) to a precision (random error) of 0.5% (approximately 2 ppm) in comparison to the data acquired from ground-based observations. This study investigated the detectability of enhanced CO2 concentrations due to anthropogenic emissions, by satellite observation.
CO2 concentrations acquired by “IBUKI” comprise not only those pertaining to anthropogenic emissions but also encompass photosynthetic uptake and respiration-release by plants; emissions due to forest fires; and sink/source by ocean. These processes should be considered when interpreting the information on anthropogenic CO2 emissions from the CO2 concentrations acquired by “IBUKI”. This study estimated CO2 concentrations due to anthropogenic activities from observational data by “IBUKI” by the method described below.
Firstly, the spatiotemporal distribution of CO2 concentrations originating from anthropogenic CO2 emissions are estimated using the data for anthropogenic CO2 emission rates from fossil fuel consumption (emission inventory) - a value based on the data for nighttime lights on the earth’s surface as observed by satellite, as well as the information from the database for fossil fuel power plants and an atmospheric tracer transport model. Subsequently, on the basis of this estimate, the observational data for CO2 concentrations acquired by “IBUKI” are classified into two categories: data including contamination by anthropogenic CO2 emissions (top panel in Figure 1) and those not including this contamination. The individual observational data sets including anthropogenic contamination are subtracted using averaged values for the data not including contamination, and values for CO2 concentrations from forest fires and plant activities are then subtracted from the data. These calculations produce the figures for anthropogenic CO2 concentrations using observational data from “IBUKI” (bottom panel in Figure 1).
2. Results of anthropogenic CO2 concentration estimates from “IBUKI”
Figure 1 shows global distribution of anthropogenic CO2 concentrations estimated from observational data from “IBUKI”. Data including contamination by anthropogenic CO2 emissions is mainly concentrated on the Northern Hemisphere, especially in mega-city regions (top panel in Figure 1).
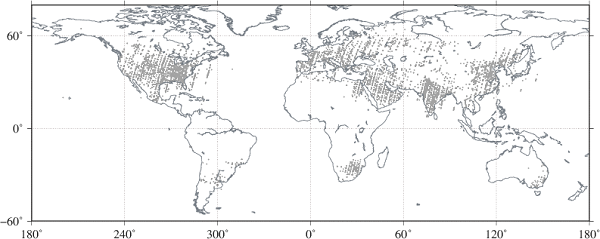
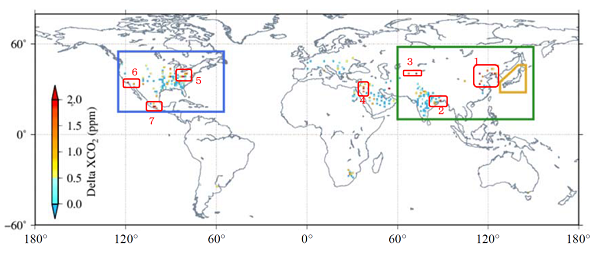
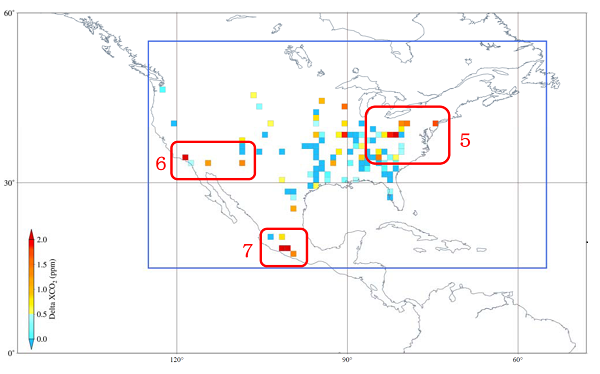
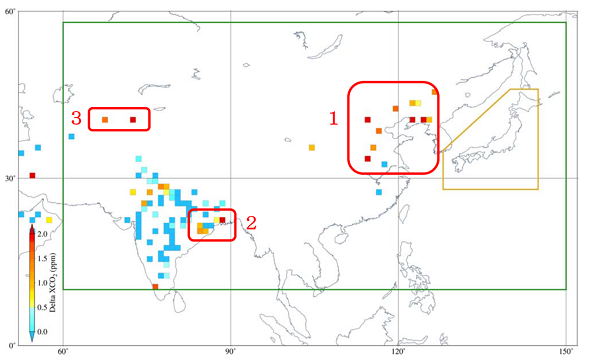
Table 1 A list of regions indicating high concentrations of anthropogenic CO2 emissions derived from “IBUKI” in Figure 1.
| No. on Figure 1 | Rough range of the region for high concentrations of anthropogenic CO2 emissions derived from “IBUKI” | Countries, regions or major cities in the region | Maximum value of the concentrations of anthropogenic CO2 emissions for the region (1 deg. × 1 deg., in 3.5 years) |
| 1 |
Latitude: 33 – 46 N
Longitude: 114 – 127 E
|
China: Zhangjiakou, Anshan, Harbin, and Tianjin | 3.8 ppm |
| 2 | Latitude: 20 – 23 N Longitude: 84 – 89 E |
India: Kolkata (Calcutta) | 2.0 ppm |
| 3 | Latitude: 40 – 41 N Longitude: 67 – 73 E |
Eastern part of Uzbekistan, Southern edge of Kazakhstan, Eastern area of Kyrgyzstan, Northern edge of Tajikistan | 2.6 ppm |
| 4 |
Latitude: 30 – 32 N
Longitude: 37 – 38 E |
Northwestern part of Saudi Arabia, Jordan | 1.8 ppm |
| 5 | Latitude: 38 – 41 N Longitude: 79 – 83 W |
The United States: Pittsburgh | 2.1 ppm |
| 6 | Latitude: 33 – 35 N Longitude: 114 – 119 W |
The United States: Los Angeles | 4.5 ppm |
| 7 | Latitude: 17 – 19 N Longitude: 99 – 102 W |
Mexico: Acapulco | 2.4 ppm |
Regions with higher CO2 concentrations from anthropogenic activities are shown in the bottom of Figure 1 and Figure 2 and summarized in Table 1. The regions in Table 1 can be identified as those with dense populations or industrial zones with fossil fuel power plants and developments of oil and gas fields.
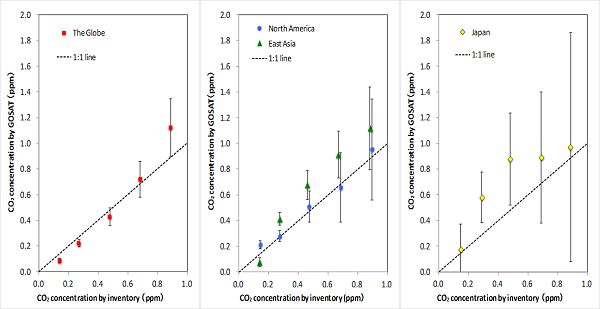
Figure 3 shows the relationships between anthropogenic CO2 concentrations derived from the emission inventory and the observational data acquired by “IBUKI” in four regions (Japan, East Asia, North America, and the globe), as shown in the bottom of Figure 1. Key aspects relating to Figure 3 are as follows:
These results suggest that “IBUKI” has the potential to detect enhanced CO2 concentrations resulting from fossil fuel consumption in mega-cities.
3. Further steps
The present estimates demonstrated the potential utility of observations by “IBUKI” and future satellites to monitor anthropogenic CO2 emissions. The methodology to improve both the frequency and net volume of observational data by satellites will be further investigated towards an enhancement of the accuracy of estimates of anthropogenic CO2 concentrations. Additionally, further studies and evaluations, for example, ground-based observation in the surroundings of large emission sources, will be implemented to refine estimates of anthropogenic emission rates from CO2 concentration measurements acquired by satellites.
Notes
1. Column-averaged concentration of CO2
The mixing ratio of CO2 molecules relative to that of dry air, from the earth's surface to the upper extremities of the atmosphere.
2. Anthropogenic CO2 concentrations estimated from inventory
Inventories of CO2 emissions from fossil fuel consumption and forest fires, a biospheric model, and an atmospheric tracer transport model were used in this study to estimate anthropogenic CO2 concentrations by inventory.
3. Inventory of CO2 emissions by fossil fuel consumption
ODIAC (Open-sources Data Inventory for Anthropogenic CO2) was used in this study as inventory for CO2 emissions by fossil fuel consumption. Oda and Maksyutov, Atmos. Chem. Phys., 11, 543-556, 2011.
4. Database of fossil fuel power plants
CARMA (Carbon Monitoring for Actions) is used in ODIAC as the database for fossil fuel power plants.
5. Inventory of CO2 emissions by forest fires
GFAS (Global Fire Assimilation System) was used in this study as inventory for CO2 emissions by forest fires. Kaiser et al., Biogeosciences, 9, 527-554, 2011.
- What's New
- What's New 2025
- What's New 2024
- What's New 2023
- What's New 2022
- What's New 2021
- What's New 2020
- What's New 2019
- What's New 2018
- What's New 2017
- What's New 2016
- What's New 2015
- What's New 2014
- What's New 2013
- What's New 2012
- What's New 2011
- What's New 2010
- What's New 2009
- What's New 2008
- What's New 2007
- What's New 2006
- What's New 2005
- What's New 2004
- What's New 2003
- What's New 2002
- Event Information
- Visit NIES